. 2021 Apr 30;10:e64811. doi: 10.7554/eLife.64811

Figure 2. Rreb1 is necessary for mouse embryonic development.

(A) Schematic diagram showing the strategy used to generate the Rreb1 mutant allele. CRISPR-Cas9 was used to delete the majority of the coding DNA sequence of Exon 6. We created a large (approximately 700 bp) and small (approximately 540 bp) deletions. Both lines exhibited comparable phenotypes, thus we combined these data. UTR, untranslated region. (B–C) Brightfield images of Rreb1+/+ and Rreb1-/- littermates at E10.5 and E11.5 Arrowheads indicate boundary of open neural tube. Righthand panels show mutant embryos at higher magnification. (D–E) Confocal maximum intensity projection (MIP) of wholemount E9.0 and 9.5 mouse embryos, scale bar (sb) 200 μm. Number of somite pairs (ss) shown on images. (D) Right panel shows an MIP frontal view and outline (dashed line) of the head of the embryo emphasizing the neural tube closure defects in the Rreb1-/-. (E) Box highlights image of posterior neuropore shown in high magnification in adjacent panel, sb 100 μm. (F) Bar chart summarizing the percentage of Rreb1+/+, Rreb1+/- and Rreb1-/- embryos recovered at each developmental stage. The first bar indicates the expected Mendelian ratios of each genotype. N numbers shown above each bar. D, dorsal; V, ventral; A, anterior; P, posterior; L, left; R, right.

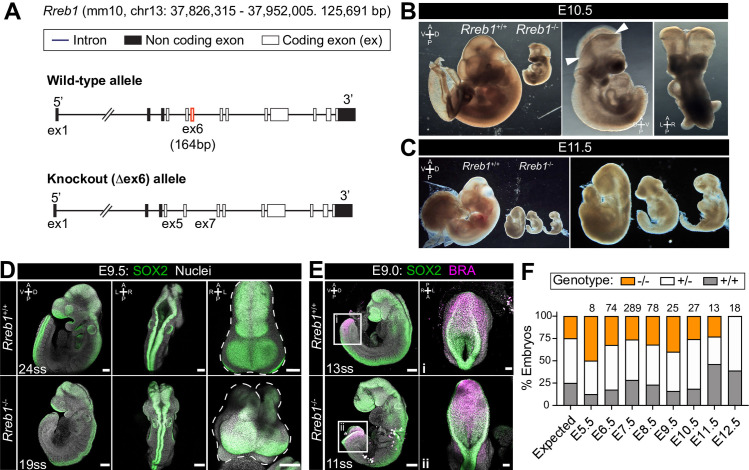
Figure 2.

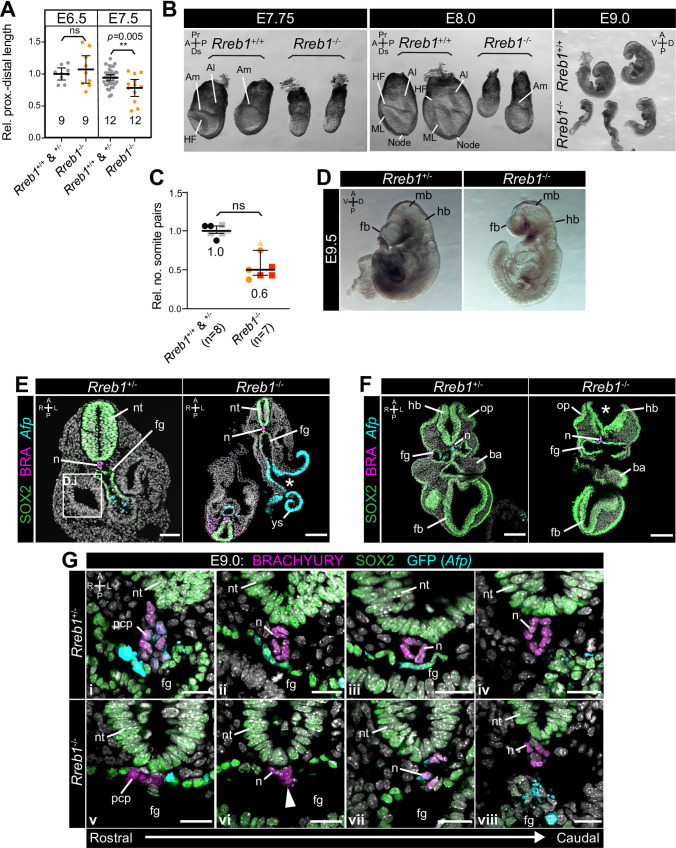
Figure 2—figure supplement 1. Rreb1 mutant embryos exhibit defects at midgestation.

Figure 2—figure supplement 1.

(A) Quantification of the proximal to distal length of Rreb1 wild-type (Rreb1+/+) and heterozygous (Rreb1+/-) versus mutant (Rreb1-/-) littermates at E6.5 (3 litters) and 7.5 (5 litters). Each point represents an individual embryo. Total number of embryos is shown on the graph. Data is shown relative to the average wild-type/heterozygote proximo-distal length of each litter. Bars represent mean and IQR. ** p=≤0.005, unpaired t-test. (B) Brightfield images of wild-type (Rreb1+/+) and mutant (Rreb1-/-) littermates at embryonic day (E) 7.75, 8.0 and 9.0. Rreb1-/- embryos are smaller than wild-type littermates and do not show stage-appropriate morphological landmarks. (C) Quantification of relative number of somite pairs in E8.5–9.5 Rreb1 wild-type (Rreb1+/+) and heterozygous (Rreb1+/-) versus mutant (Rreb1-/-) littermates. Each point represents an individual embryo. Data is shown relative to the average somite number of each litter. Separate litters are indicated by different colored points. Bars represent mean and IQR. (E–F) Transverse cryosections of E9.0 Rreb1 heterozygous and homozygous mutant, Afp-GFP littermates. Boxes mark the regions shown in higher magnification in H. Asterisks mark the open neural tube and gut tube in Rreb1-/-. Sb, 50 μm. (G) Confocal optical sections of transverse cryosections from E9.0 embryos in the region of the notochord. From left to right, images show sections from rostral to caudal regions of the anterior embryo. Sb, 20 μm. Pr, proximal; Ds, distal; A, anterior; P, posterior; L, left lateral; R, right; D, dorsal; V, ventral; Am, amnion; Al, allantois; HF, headfolds; ML, midline; n, notochord; nt, neural tube; fg, foregut; ys, yolk sac; pcp, prechordal plate; hb, hindbrain; op, otic pit; ba, branchial arch; fb, forebrain; mb, midbrain.