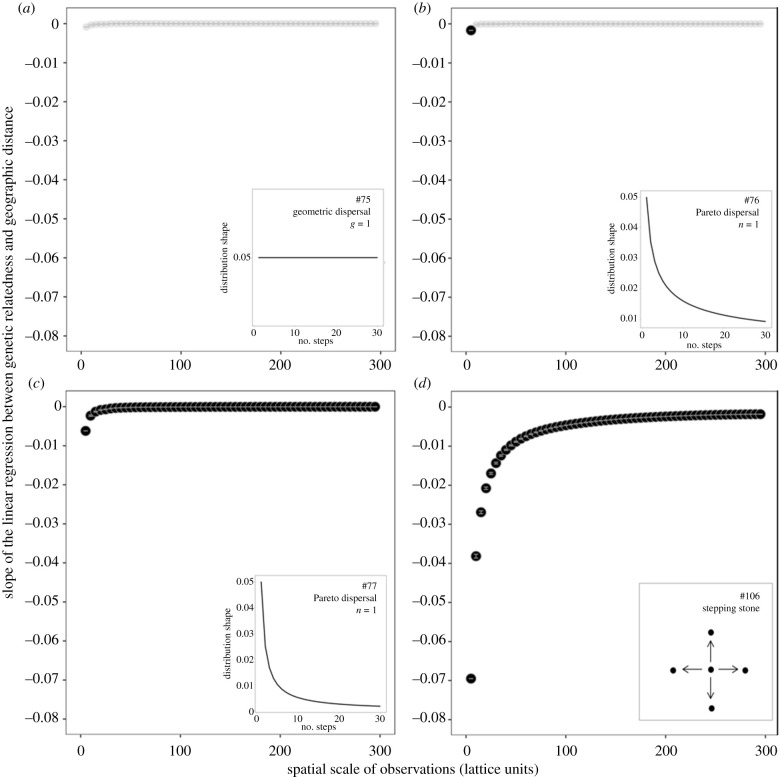
Figure 3.
Results from four representative genetic simulations. The slope of the linear regression between genetic relatedness and geographic distance among pairs of samples at various spatial scales of observation. Slope averages and error bars from a resampling procedure (see Methods). The slopes that are statistically significant following the standardized effect size (SES) procedure (see Methods) are highlighted in bold. The four panels show four scenarios with different dispersal kernels that vary in the proportion of long-distance dispersal. Total emigration rate = 0.1 for all simulations with the following dispersal function: (a) geometric, g = 1, (b) Pareto, n = 0.5, (c) Pareto, n = 1, and (d) stepping stone (dispersal between neighbouring nodes only). The dispersal kernel used for each panel is illustrated in the inset (the numbers 75, 76, 77, and 106 refer to the simulation ID in electronic supplementary material table S4, where the details of the simulation parameters are presented). The four simulations illustrate the range of the results that were observed in the simulations, from a slight increase in IBD at small spatial scales and a pattern that is never significant (a) to a marked increase in IBD at small spatial scales and a pattern that is significant at all spatial scales (d).

