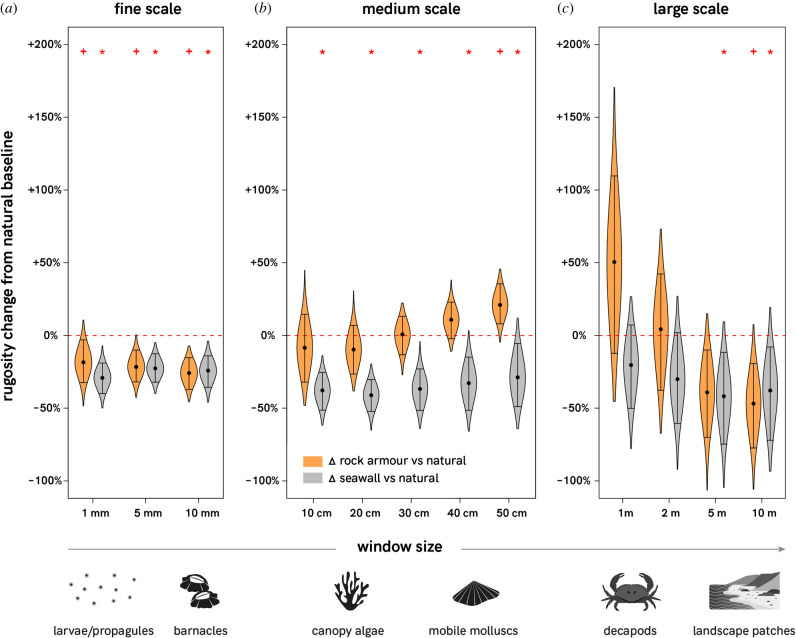
Figure 3.
The difference in mean surface rugosity of rock armour (orange) and seawalls (grey) compared to the baseline of natural rocky shores (red dashed line) at (a) fine, (b) medium and (c) large scales of measurement. Black dots represent the median difference in mean surface rugosity calculated from 1000 permutations (resampling with replacement). Whiskers represent the upper and lower 95% confidence intervals. Violins plotting above or below the red line suggest the artificial structures have higher or lower rugosity, respectively, than natural shores at each of the given scales (windows). Red crosses and stars indicate significant differences between natural and rock armour, and natural and seawalls respectively (via permutation testing at p < 0.05, see electronic supplementary material, table S4). Suggested ecological relevance of different scales is illustrated along the bottom of the x-axis (see electronic supplementary material, table S2 for evidence to support ecological relevance).

