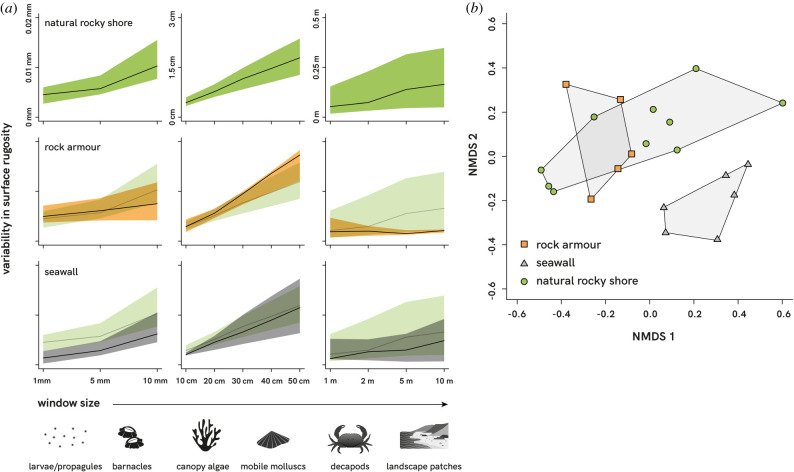
Figure 4.
(a) Variability (standard deviation) in surface rugosity across scales recorded on natural rocky shores and artificial coastal structures (rock armour and seawalls) around Wales, UK. Solid lines represent the mean site-level variability (50th percentile) and shaded areas indicate the 95th and 5th percentiles. The distribution of variability recorded on natural shores is semi-transparently underlain with those recorded on artificial structures for comparison. (b) nMDS ordination, based on Gower dissimilarities, of variation in multiscale surface rugosity between rock armour (orange squares), seawalls (grey triangles) and natural rocky shores (green circles).

