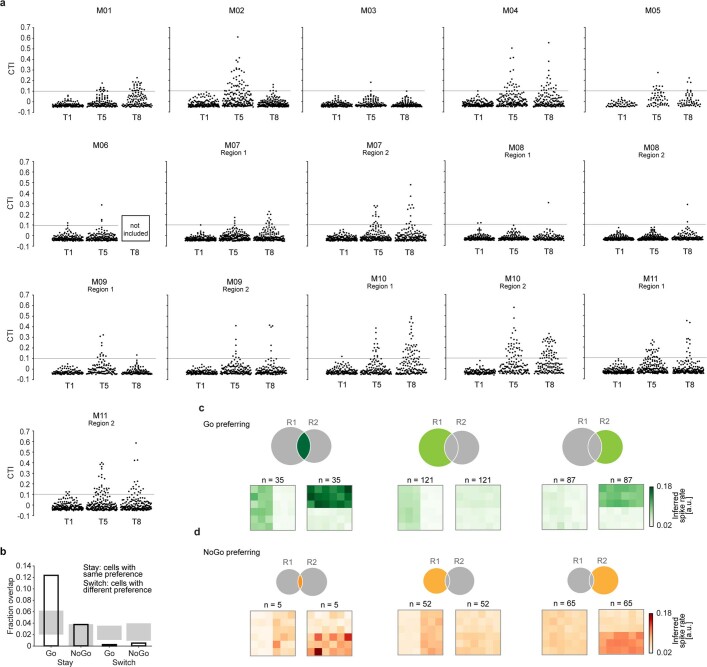
Extended Data Fig. 6. Category-tuning index distributions of all recorded field of views at T1, T5 and T8 and the overlap of populations of category-selective cells.
a, Category-tuning index before learning (T1, according to rule 1), after the mouse had learned rule 1 (T5, according to rule 1) and after it had learned to categorize stimuli according to rule 2 (T8, according to rule 2). Each imaging region is displayed individually. Individual cells are represented as dots. Only cells recorded at all imaging time points were included. Grey line indicates the threshold CTI value of 0.1 that was applied to classify cells as category-selective. b, Black, the fraction of overlap between category-selective groups found at T5 and T8 (Go stay/NoGo stay: Go/NoGo category-selective at both T5 and T8; Go switch: Go category-selective at T5 and NoGo category-selective at T8; NoGo switch: NoGo category-selective at T5 and Go category-selective at T8). Grey denotes 95% confidence intervals of chance population overlap (Methods). c, Go category-selective cells. Top row, Venn diagrams of the fraction of cells that were category-tuned only for rule 1 (R1), only for rule 2 (R2) or for both rules (area between R1 and R2). The highlighted part of the Venn diagram indicates which data are shown in the bottom row. Bottom row, mean stimulus response amplitude (inferred spike rate) after rule 1 (left) or rule 2 (right) was learned. d, As in c, for NoGo category-selective cells.

