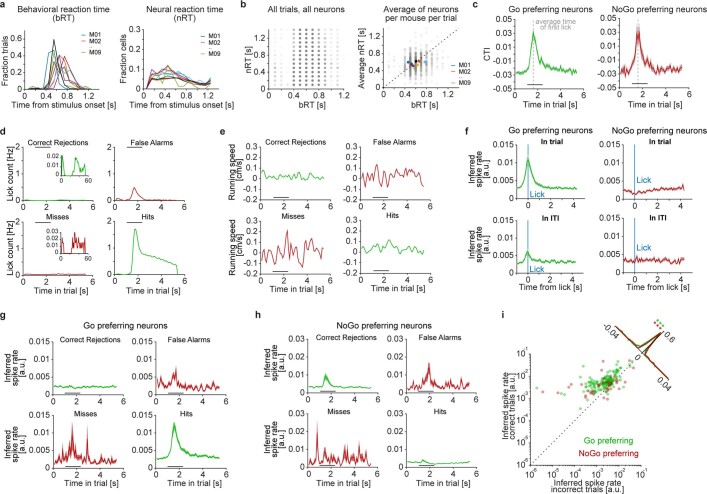
Extended Data Fig. 8. Relation between motor behaviour and neuronal responses of category-selective cells.
a, Line histograms showing the count probability of behavioural (left) and neural (right) reaction times of individual mice. Behavioural reaction time (bRT) was measured as the time of the first lick after stimulus onset, neural reaction time (nRT) as the time of the neuronal response onset after stimulus onset. b, Left, scatter plot of bRT and nRT for every trial of every mouse in session T5. P = 2.3 × 10⁻¹³, rho = 0.08, Spearman’s correlation (n = 9,348 measured reaction times). Right, grey circles: scatter plot showing the average nRT (that is, the nRT averaged across all Go category-selective neurons, but separated per mouse and trial) versus the bRT per mouse and trial. P = 6.2 × 10⁻⁶, Pearson’s r = 0.13 (n = 1,156 trials). The density of grey circles is indicated by the colour intensity (alpha value). Coloured circles: the overall mean nRT and bRT of each mouse. P = 0.51, Pearson’s r = 0.26 (n = 9 mice). Dashed line denotes the unity line. c, CTI of Go (left) and NoGo (right) category-selective neurons, calculated for every imaging frame individually. Data show the period from 1 s before stimulus onset to 3 s after stimulus offset. Grey dashed line denotes the average time of first lick. Black line denotes the average period of stimulus presentation. d, Mean lick frequency in session T5, grouped by trial outcome (hits, misses, correct rejections and false alarms). Insets show the same data with inflated y axis. Black line denotes the average period of stimulus presentation. e, As in d, but showing the average running speed. f, Inferred spike rate of Go (left) and NoGo (right) category-selective neurons aligned to the onset of lick-bouts. Top row, lick-bouts detected within a trial. Bottom row, lick-bouts detected in the inter-trial-interval. Data are mean ± s.e.m. g, Inferred spike rate of Go category-selective neurons in session T5, grouped by trial outcome (hits, misses, correct rejections and false alarms). Black line denotes stimulus presentation. Data are mean ± s.e.m. h, As in g, for NoGo category-selective neurons. i, Scatter plot showing the mean inferred spike rate in correct trials versus incorrect trials, for individual Go (green) and NoGo (red) category-selective neurons. PGo = 1.0 × 10⁻²⁶, Pearson’s rGo = 0.72, PNoGo = 4.1 × 10⁻⁵, Pearson’s rNoGo = 0.52 (nNo = 156, nNoGo = 57). Black line denotes the unity line. Line histogram shows the distribution of difference from unity separately for Go and NoGo-preferring neurons. PGo = 6.6 × 10⁻²², PNoGo = 1.9 × 10⁻⁵, two-tailed WMPSR (nGo = 156, nNoGo = 57).

