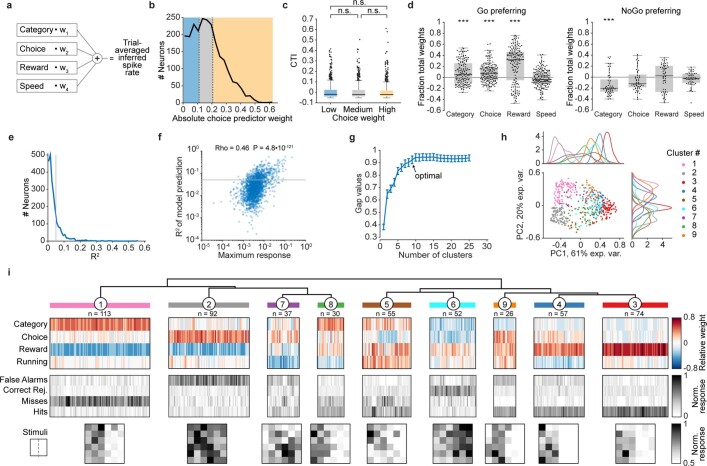
Extended Data Fig. 9. mPFC contains neural correlates of multiple task components.
a, Linear regression model, fitting the trial-averaged inferred spike rates of individual neurons at T5 (‘wi’ denotes the predictor weight; category predictor 0: category 1; 1: category 2; Methods). b, Distribution of absolute choice predictor weight of all observed neurons, divided into low, middle and high weight groups with equal numbers of cells. c, Box plots of CTI distributions for the choice weight groups in b. Boxes show the first to third quartile of the distributions, and black line denotes the median. There was no significant difference between the distributions, showing that category selectivity is not observed exclusively in highly choice-correlated cells. P = 0.92, Kruskal–Wallis test comparing all groups, chi-squared = 0.158, d.f. = 2. d, Relative weights of linear regression predictors (category identity, choice, reward and running speed) of Go and NoGo category-selective cells at T5. Left, category, choice and reward predictors show a significant deviation from 0. Right, only the category predictor shows a significant difference from 0. PGo-w1 = 6.8 × 10⁻⁵, PGo-w2 = 2.3 × 10⁻⁷, PGo-w3 = 2.0 × 10⁻¹⁴, PGo-w4 = 0.17, PNoGo-w1 = 3.9 × 10⁻⁵, PNoGo-w2 = 0.03, PNoGo-w3 = 0.68, PNoGo-w4 = 0.11, two-tailed WMPSR tests, Bonferroni corrected for four comparisons (nGo = 156, nNoGo = 57 cells). Grey boxes span the first to third quartile, black lines show the median. e, Distribution of R2 values, black line at 0.05 denotes the cut-off for cells included in hierarchical clustering (resulting in 536 out of 2,306 neurons, largely excluding unresponsive neurons). f, Correlation of the R2 value of individual cells and their maximum average response to correct or incorrect trials of either category. P = 4.8 × 10−121, rho = 0.46, Spearman’s correlation (n = 2,306 cells). Grey line denotes the R2 cut-off shown in e, which eliminated mostly unresponsive neurons. g, Gap statistic of hierarchical clustering for varying cluster numbers. Arrow denotes the optimal number of clusters (nine clusters; Methods). Error bars denote the standard error of the gap statistic value. h, Principal component analysis of model weights shows cluster separation along the major axes of variance. Line histograms show distributions per cluster along PC1 and PC2 separately. Individual neurons (dots) are colour-coded by cluster identity. i, Top, dendrogram showing cluster linkage. Second row, for each neuron, relative weights of model predictors in each of the nine clusters. Third row, for each neuron, normalized responses in the four different trial outcomes. Fourth row, per cluster, mean normalized response to every stimulus.

