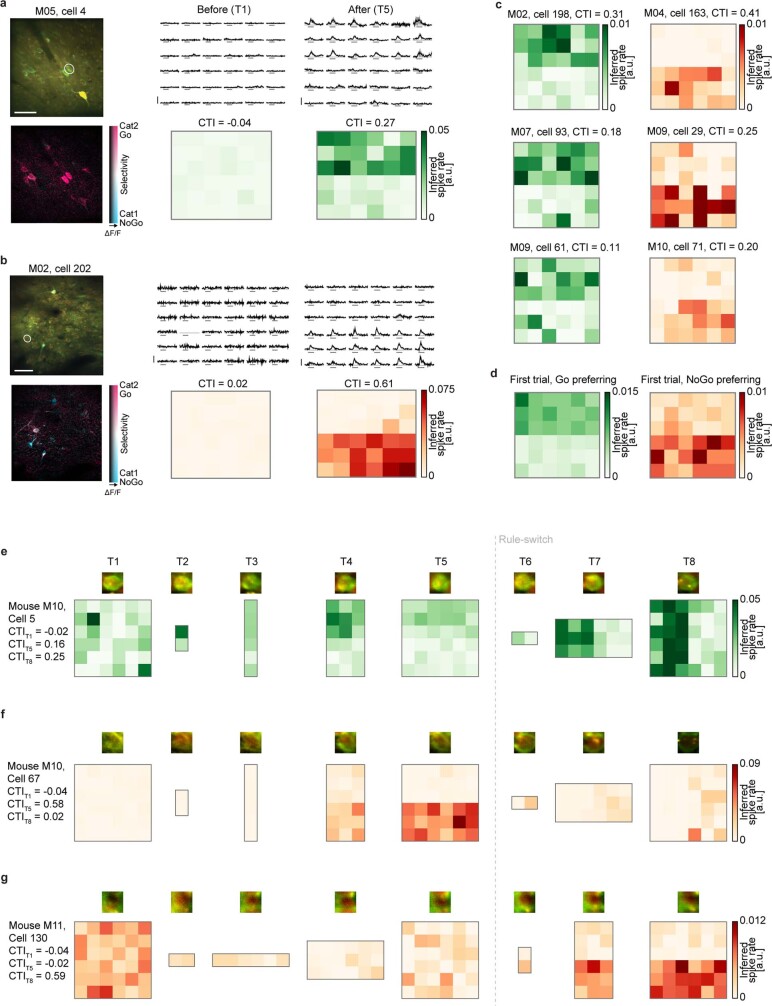
Extended Data Fig. 5. Examples of single cells that became category-selective over the course of learning.
a, Example Go category-selective cell (from the mouse shown in Fig. 2). Top left, position of the cell in the two-photon image. Scale bar, 30 μm. Bottom left, HLS map of the example region (hue: category identity of the presented stimuli; cyan, category 1; pink, category 2; lightness: response amplitude; saturation: selectivity for the stimulus category). Top middle, before learning (T1), ΔF/F traces aligned to stimulus onset. Scale bar, 100% ΔF/F. Grey bar denotes stimulus presentation, 1.3 s. Bottom middle, mean inferred spike rate per stimulus. Right, after learning (T5). b, As in a for an example NoGo category-selective cell. c, Mean inferred spike rate per stimulus for six further category-selective cells from different mice. d, Response amplitude during the first presentation of each stimulus, averaged across all category-selective cells at T5. Left, green: Go-preferring neurons; right, red: NoGo-preferring neurons. e, Top row, 40 by 40 pixel cropped images showing a Go category-selective cell in the averaged two-photon imaged field of views (pseudo-coloured). Bottom row, mean inferred spike rate of the response of the example cell to the presented stimuli at each imaging time point. f, g, As in e, but for different, NoGo category-selective cells.

