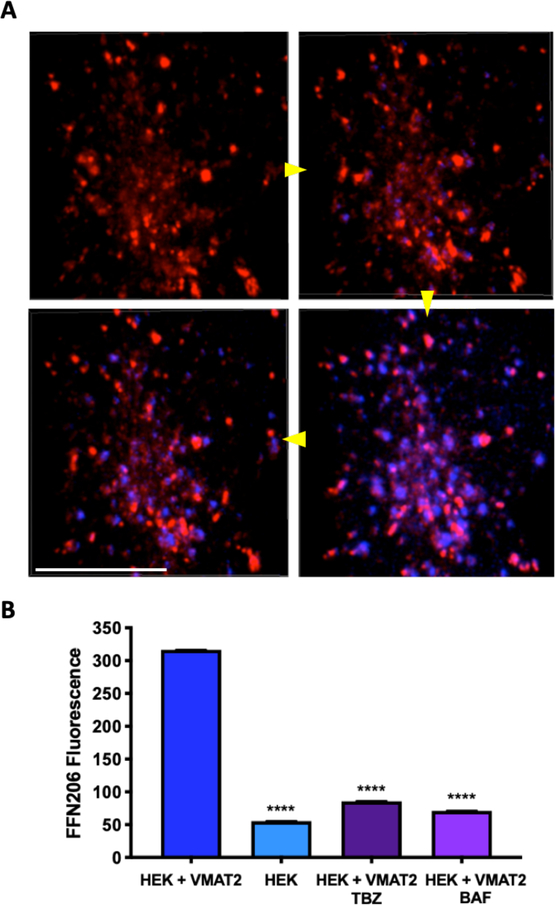
Figure 2. Real-time uptake of FFN206 in a single cell.
A. Sequential stills taken from a video of FFN206 uptake (blue fluorescence) into the vesicle-like compartments of a single HEK cell stably transfected with mCherry-tagged VMAT2 (red fluorescence). Still photos taken at 0.93s, 3.18s, 3.94s, and 5.94s following FFN206 application. Scale bar = 10 μM. Yellow arrows indicate image progression. B. Comparison of peak FFN206 fluorescence in the final 20 seconds of 1000 total seconds of uptake. HEK+VMAT2 cells display significantly greater fluorescence than HEK cells and HEK+VMAT2 cells treated with tetrabenazine or bafilomycin. Bars are displayed as mean and standard error of the mean. (One-way ANOVA with Dunnett’s multiple comparisons post-hoc test **** p <0.0001 vs. control column HEK+VMAT2).

