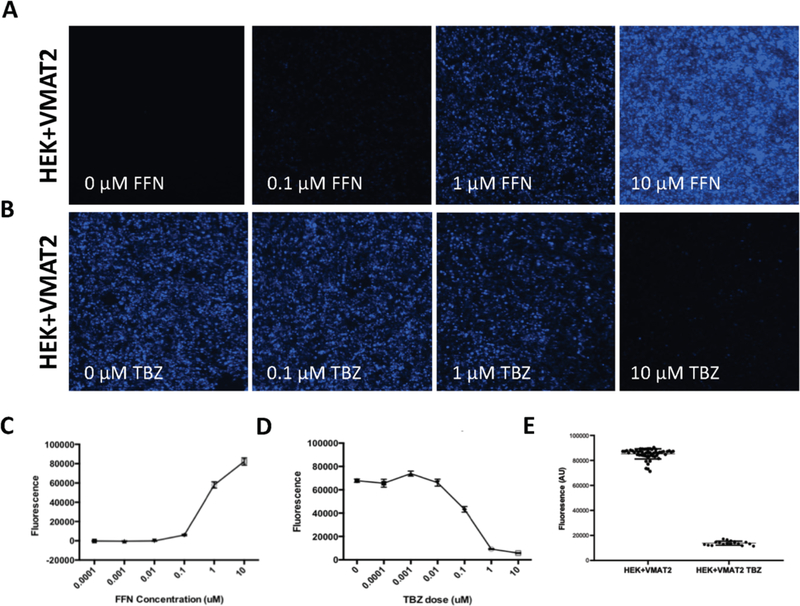
Figure 3. Determining optimal parameters for a FFN206 96-well plate assay.
A. Representative images of HEK+VMAT2 cells treated with 0, 0.1, 1, or 10 μM of FFN206. Cells imaged at 10x magnification. B. Representative images of HEK+VMAT2 cells treated with 0, 0.1, 1, and 10 μM of tetrabenazine (TBZ) and 1 μM FFN206. Cells imaged by EVOS system at 10x magnification. Scale bar = 400 μM. C. Quantification of fluorescence in 3A demonstrating FFN206 fluorescence increases as FFN206 dose increases. D. Quantification of fluorescence in 3B demonstrating FFN206 fluorescence decreases as tetrabenazine dose increases. E. Quantification of FFN206 fluorescence in HEK+VMAT2 cells treated with 1 μM FFN206 and 0 μM TBZ compared to cells treated with 1 μM FFN206 and 10 μM TBZ.

