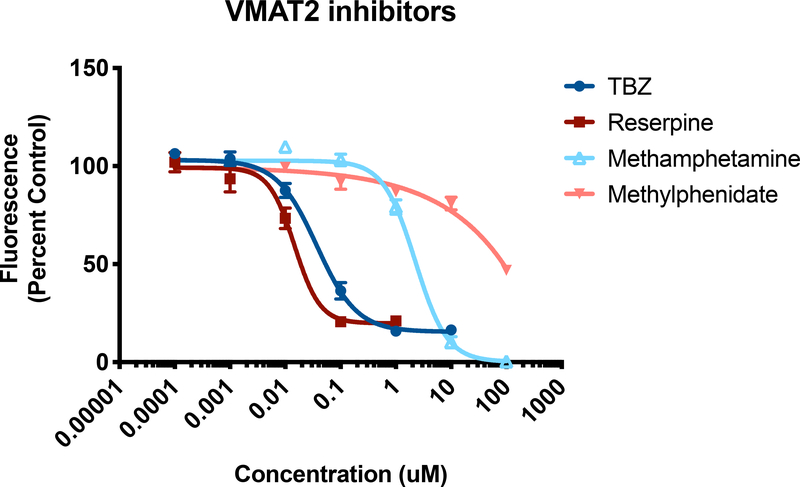
Figure 4. Screening pharmacological inhibitors of VMAT2.
HEK+VMAT2 cells were treated with 0.0001, 0.001, 0.01, 0.1, 1, and 10 μM of tetrabenazine (TBZ); 0.0001, 0.001, 0.01, 0.1, 1, and 10 μM of reserpine; 0.01, 0.1, 1, 10, and 100 μM of methamphetamine; or 0.01, 0.1, 1, 10, and 100 μM of methylphenidate. FFN206 fluorescence represented as percent of control (HEK+VMAT2 cells treated with 0 μM drug). Graphs depict mean and standard error of the mean and curves represent non-linear regressions.

