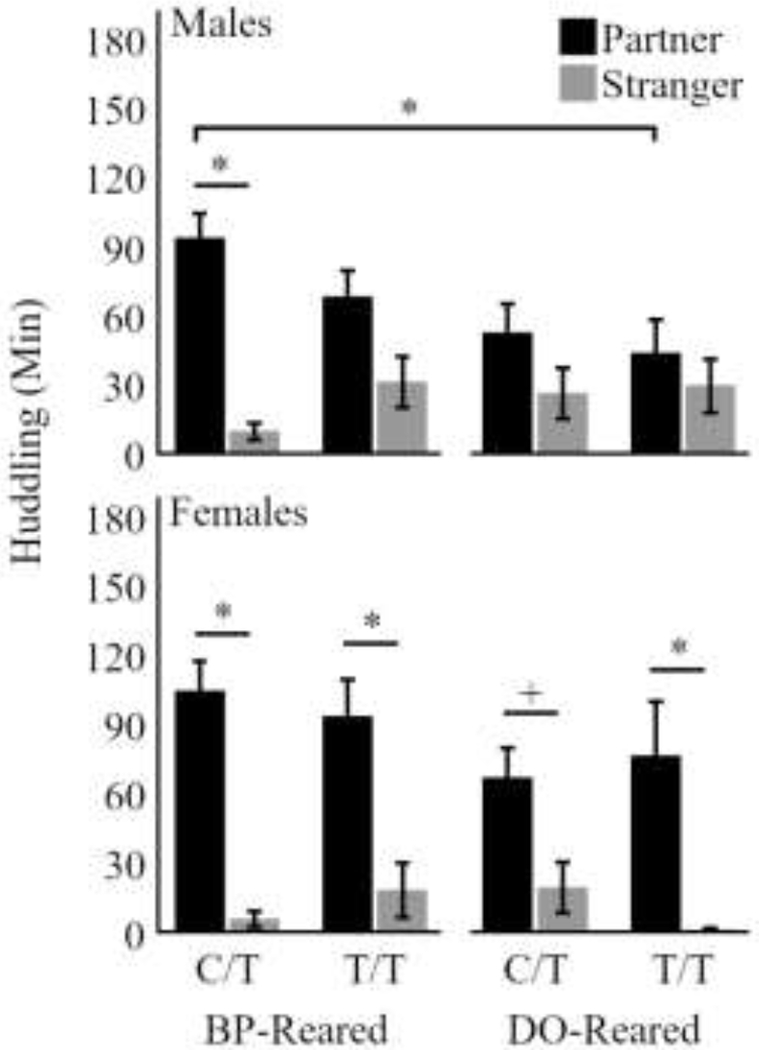
Figure 2.

Duration of huddling with the partner (black) and stranger (gray) for eight subgroups. Males are represented in the top row and show that BP-reared C/T males exhibit a robust partner preference (p < 0.05), whereas BP-reared T/T males and DO-reared males of both genotypes do not. Further, DO-Reared T/T males huddled significantly less with the partner than BP-Reared C/T males (p < 0.05). Females are represented in the bottom row and they exhibited a significant (or trending) partner preference in all subgroups. Bars represent means ± SEM. * p < 0.05, + p < 0.1.
