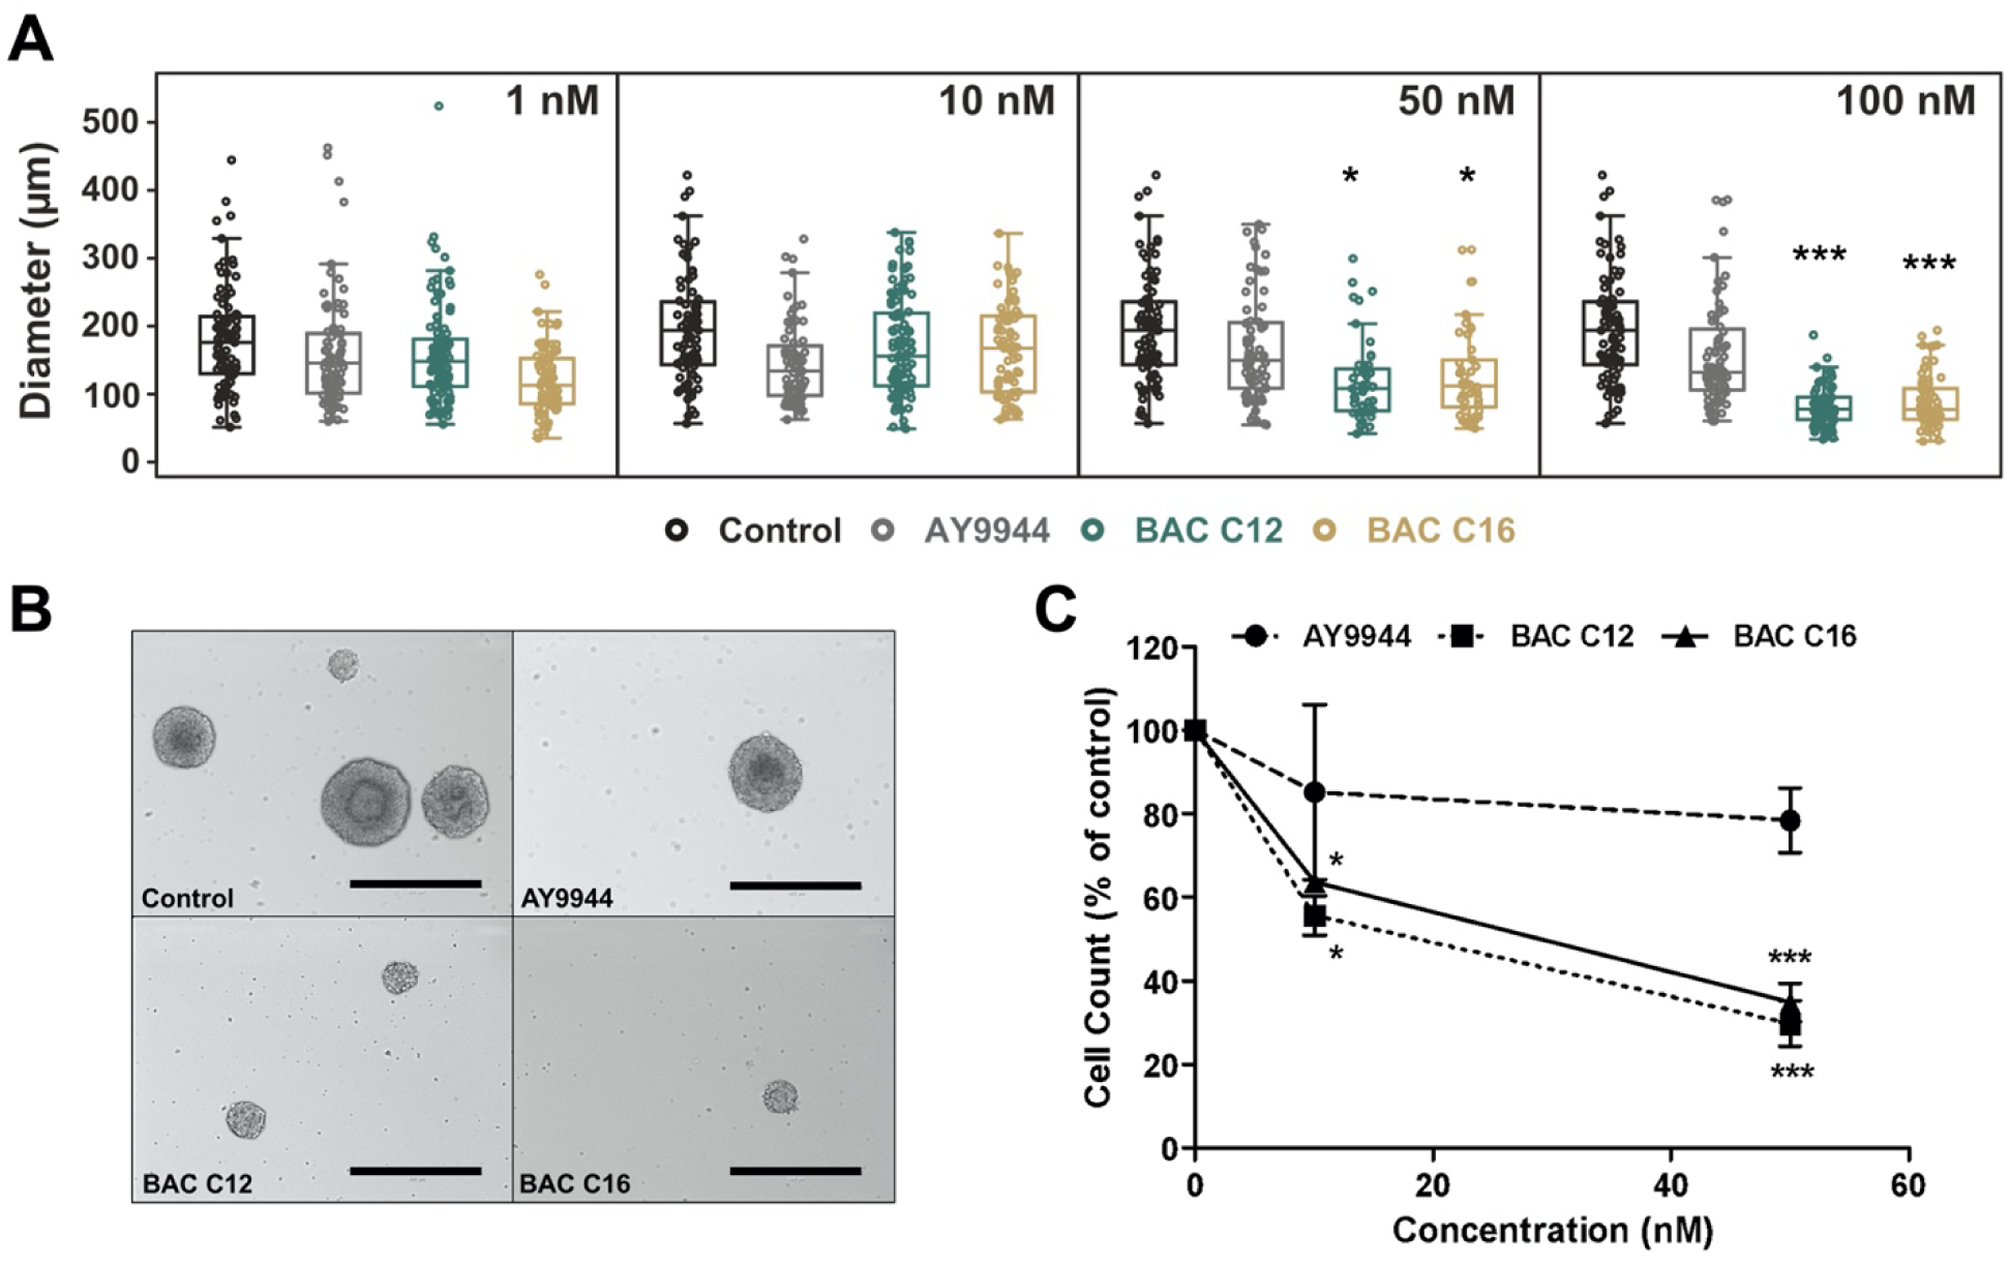
Figure 1. BACs reduce neurosphere growth.

(A) Size distribution of neurospheres exposed to vehicle control, AY9944 (positive control), BAC C12, or BAC C16 at a concentration of 1, 10, 50, and 100 nM from DIV 4 to DIV 7. (B) Representative brightfield images of neurospheres exposed to a concentration of 50 nM from DIV 4 to DIV 7 (scale bar: 400 μm). (C) Number of neural progenitor cells from dissociated neurospheres exposed to vehicle control (0 nM), AY9944, BAC C12, or BAC C16 at 10 and 50 nM from DIV 4 to DIV 7. N = 4 biological replicates per condition. Adjusted P value: *, P < 0.05; **, P < 0.01; ***, P < 0.001.
