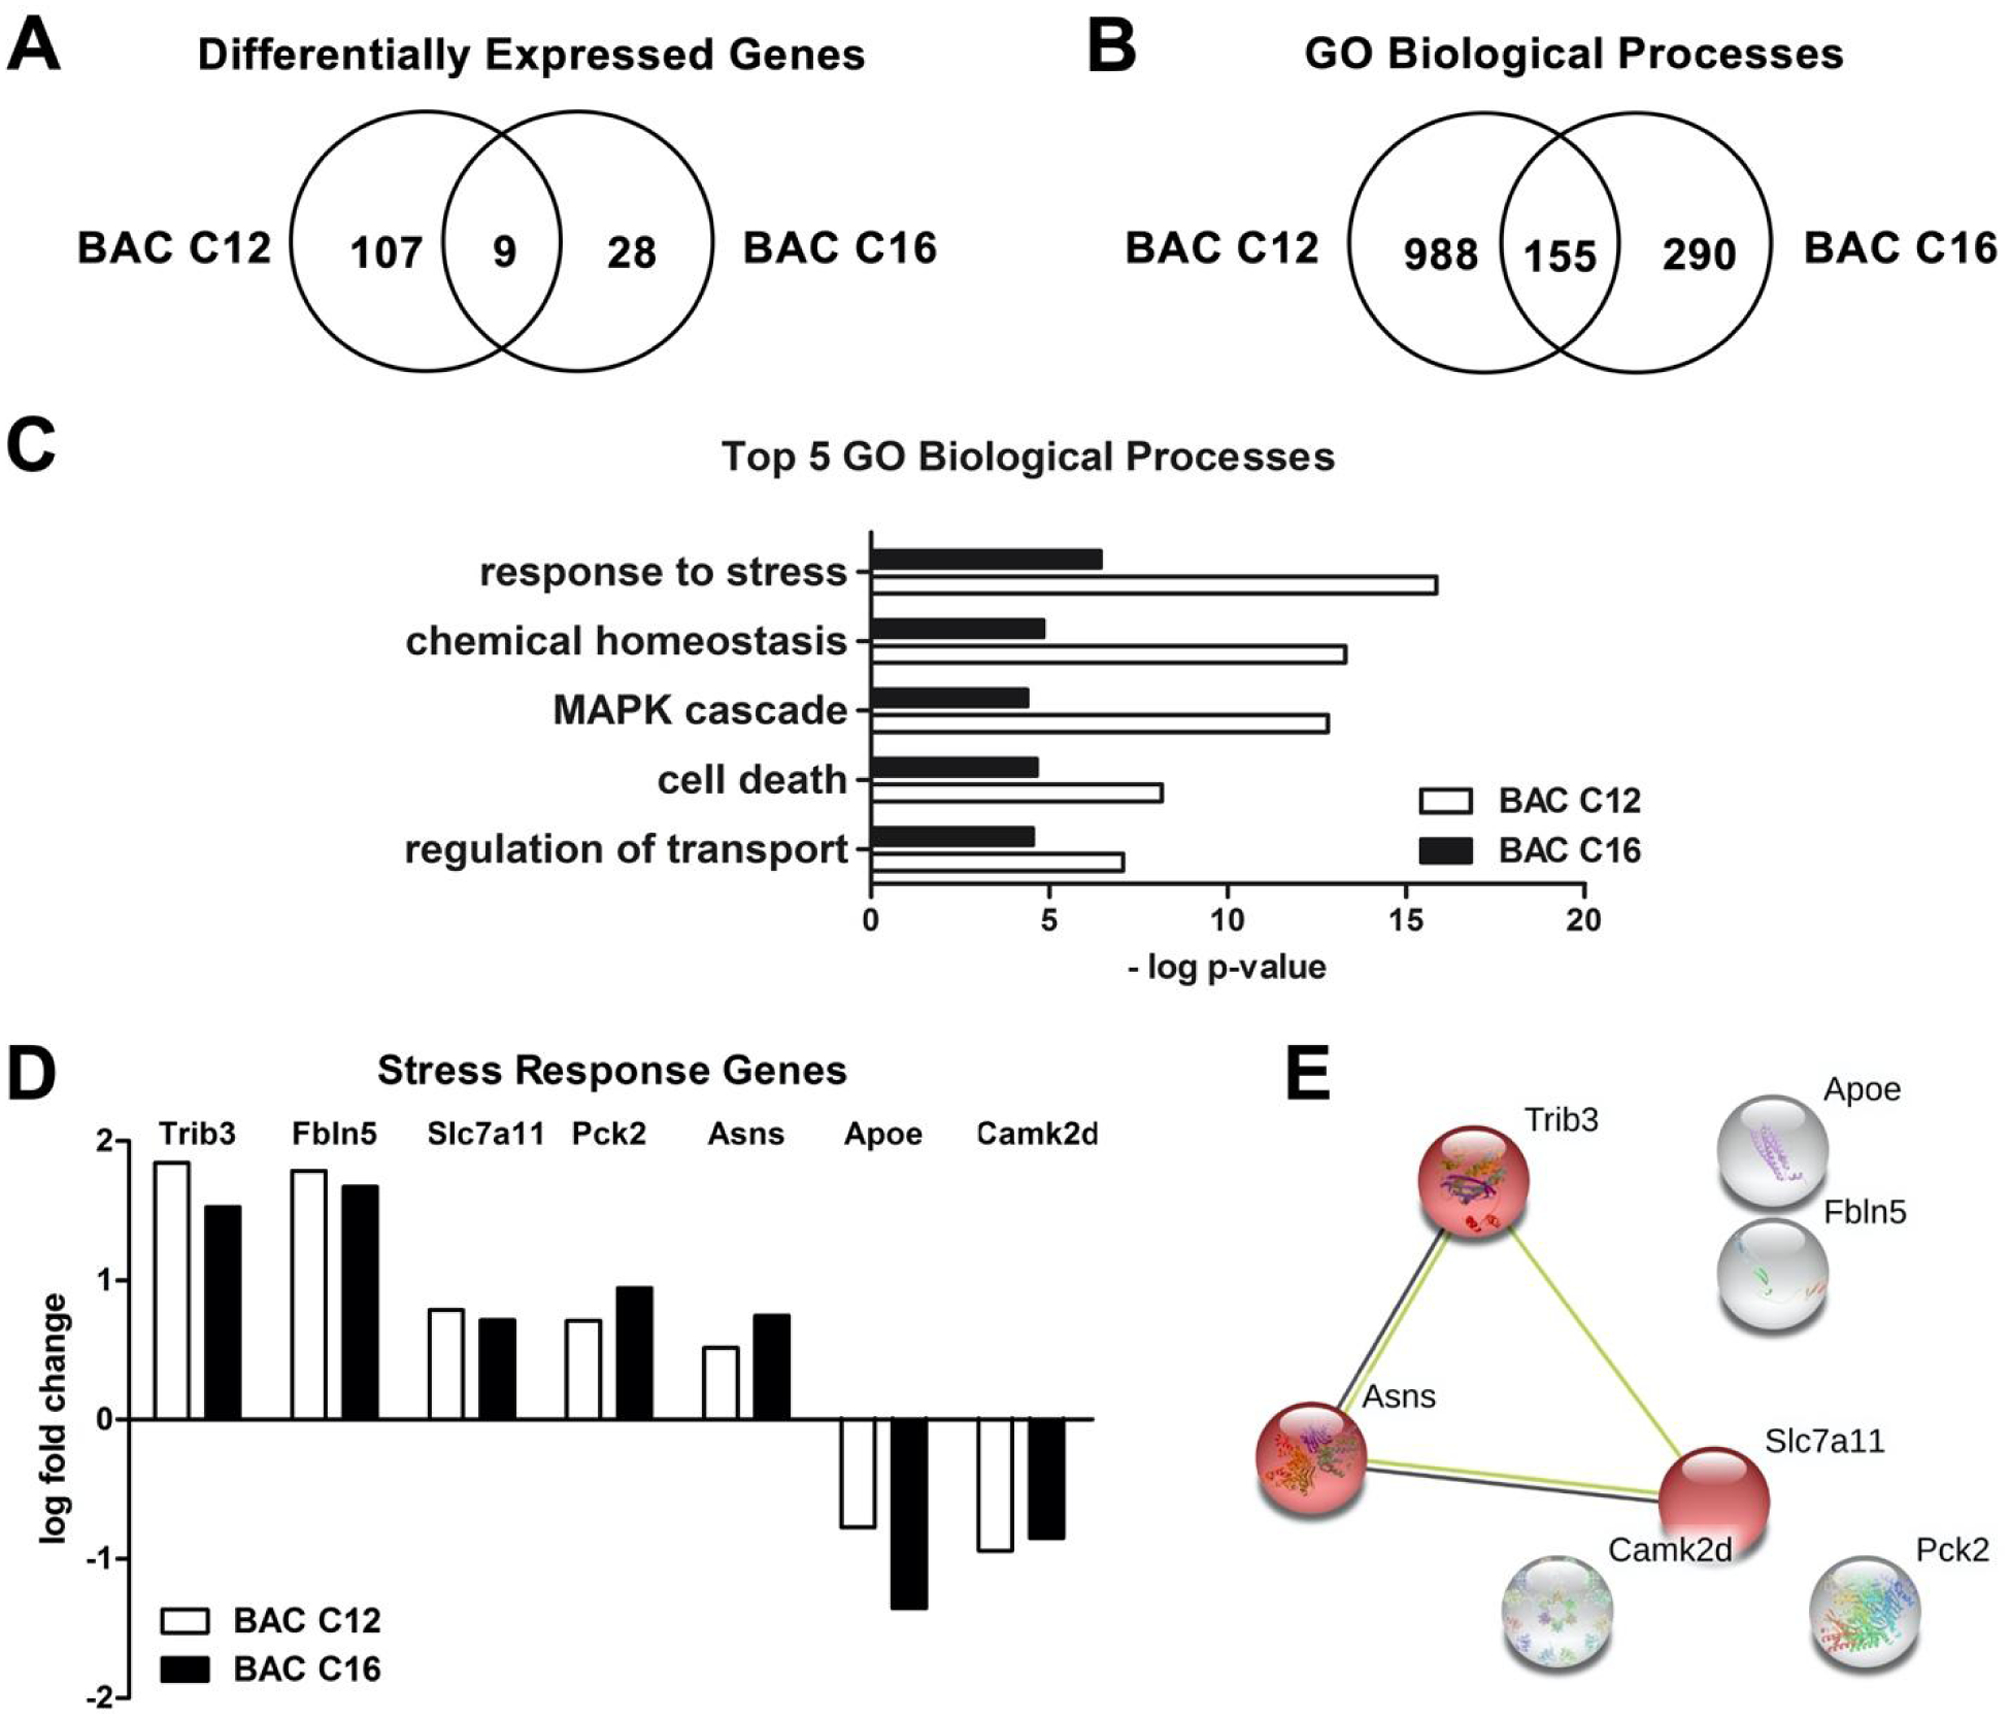
Figure 5. Transcriptome analysis indicates a stress response in BAC-exposed neurospheres.

(A) Venn diagram of DEGs from neurospheres exposed to 50 nM BAC C12 or BAC C16 from DIV 4 to DIV 5. (B) Venn diagram of GO biological processes affected by either or both BACs. (C) Top 5 significantly enriched GO biological processes. (D) Co-regulated DEGs involved in the “response to stress” biological process. (E) STRING analysis of DEGs co-regulated by both BACs. Red indicates genes involved in the integrated stress response. N = 3 biological replicates per condition. Adjusted P values for all DEGs are < 0.05.
