Figure 1:

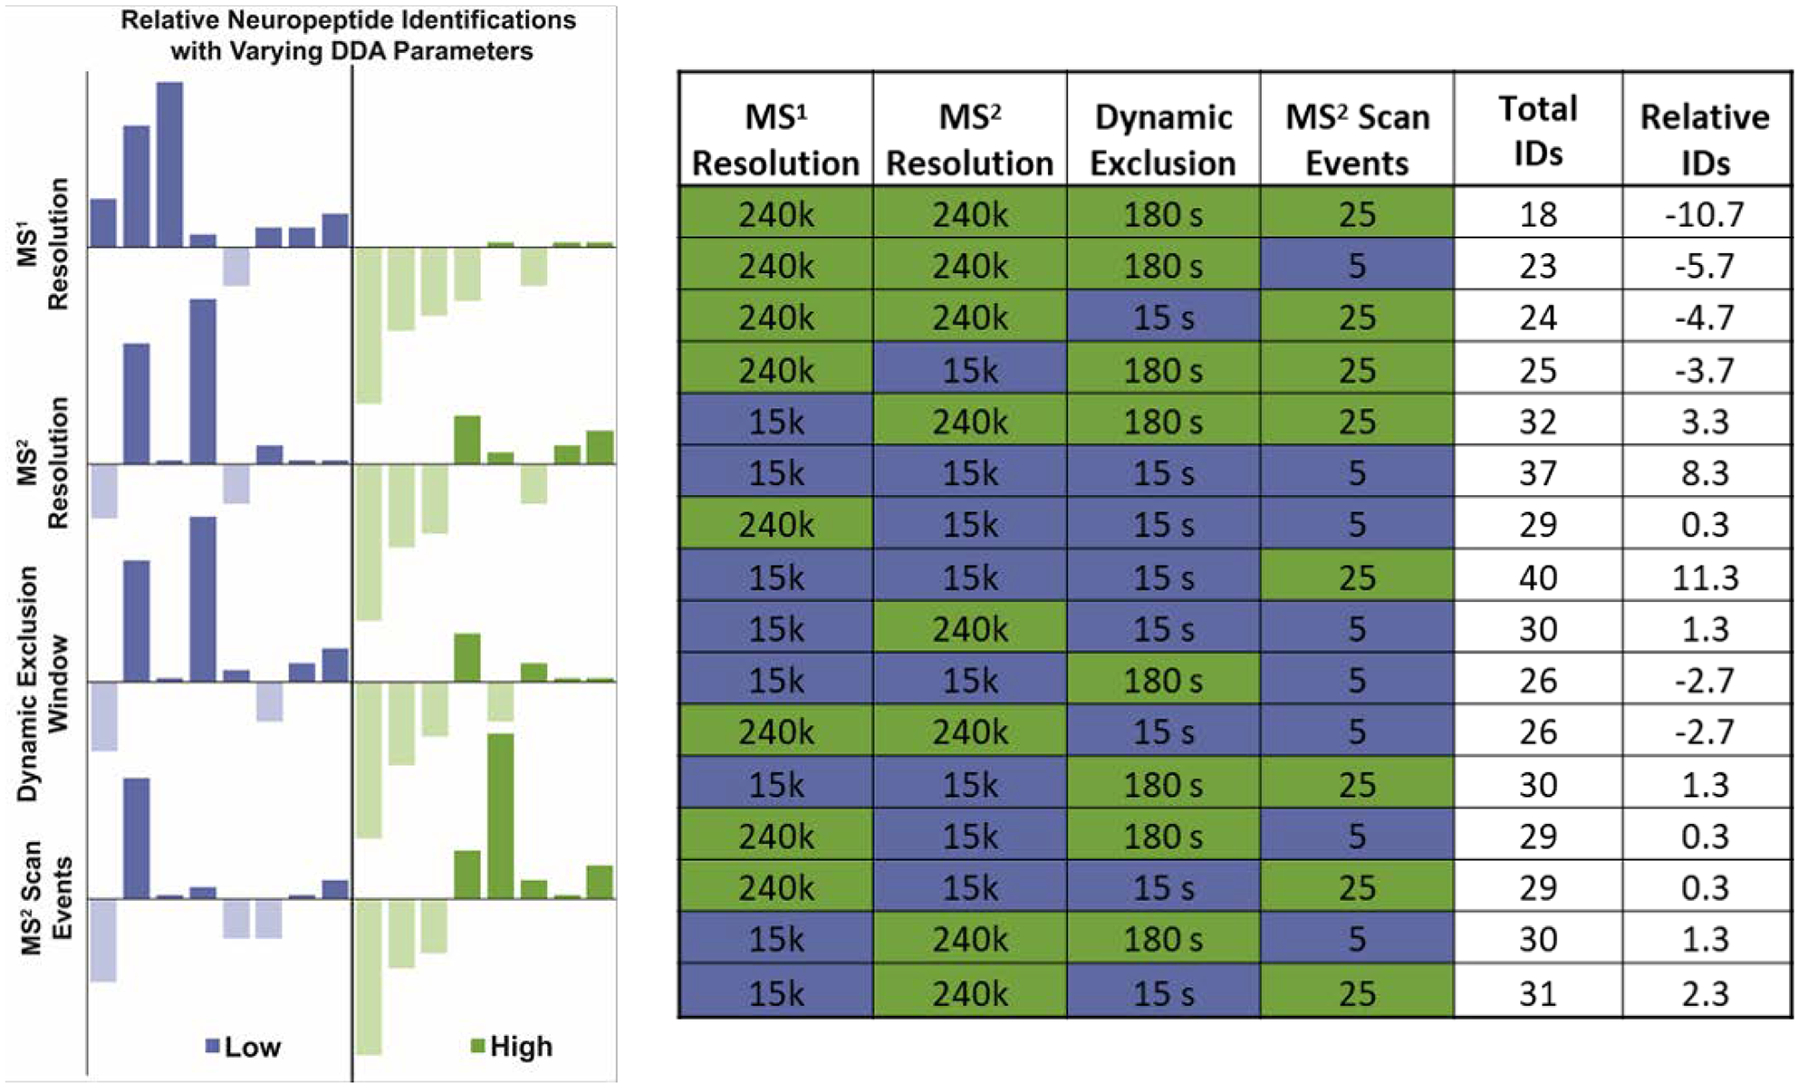
Results from factorial DoE. The data is shown as bar graphs on the left with each of the y-axes representing the deviation from the average number of neuropeptides identified across all 16 conditions. The 16 conditions are represented in each plot; the different plots are merely arranged by low/high (blue/green) values for the selected parameter to more quickly visualize how the number of neuropeptides identified changes when a selected parameter is low/high, regardless of the other parameters. The numeric values are provided in the table shown at right. The Total IDs column represents the total neuropeptides identified and the Relative IDs are the deviations from the average across the 16 conditions.
