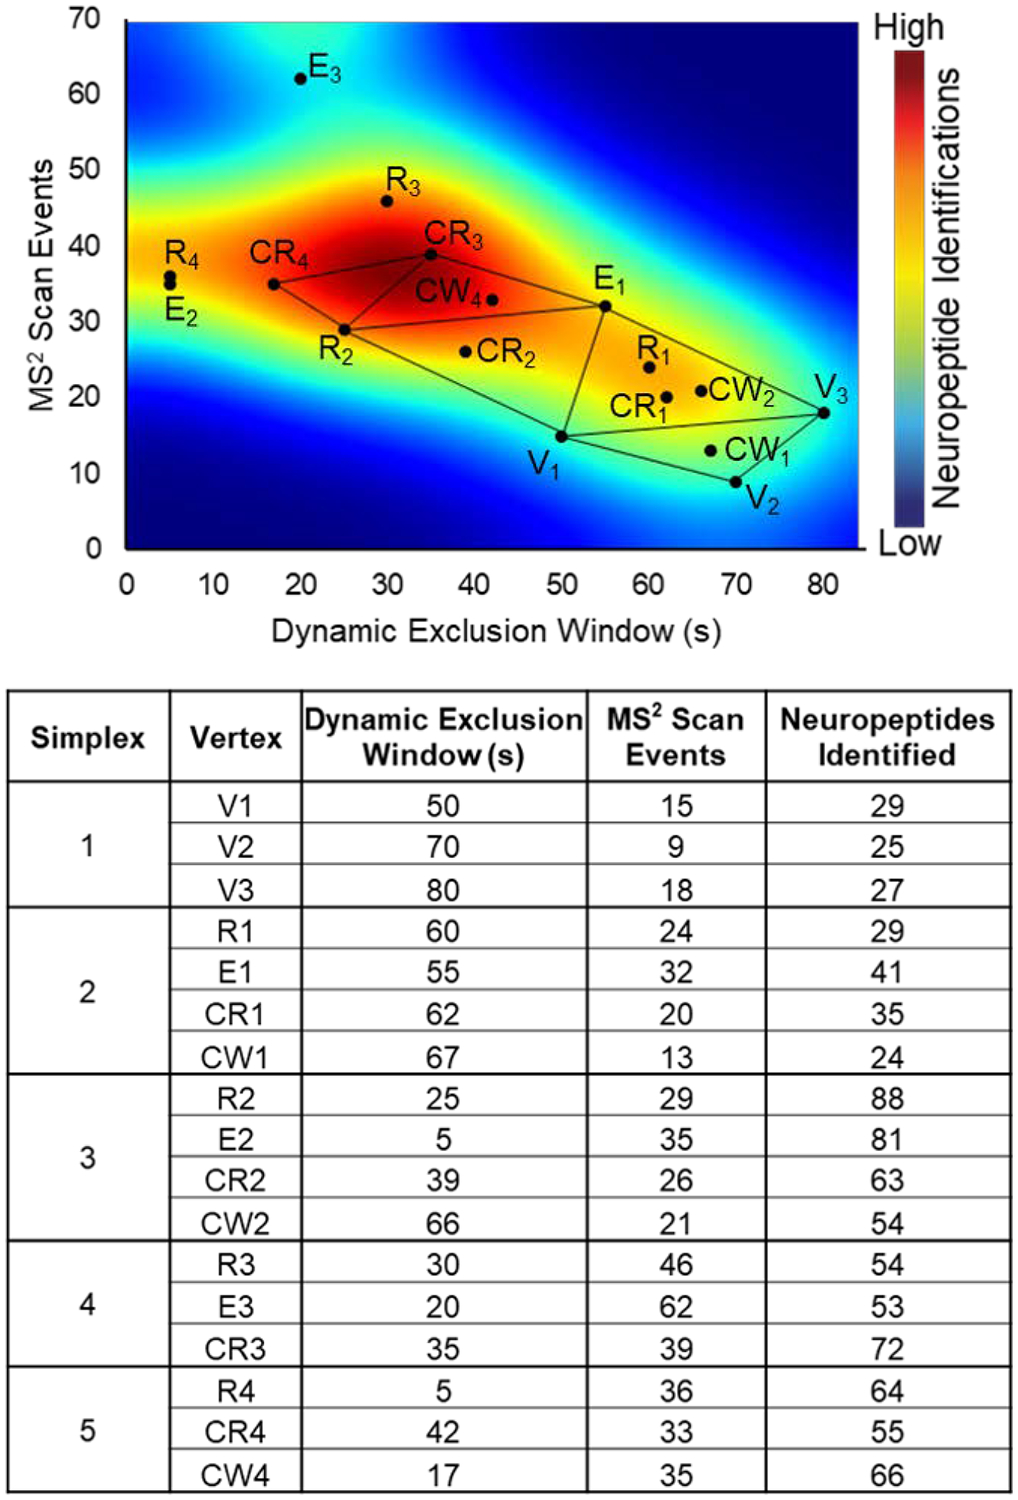
Figure 2:

Modified simplex optimization. The optimization of the dynamic exclusion window and number of MS2 scan events is represented graphically with an overlaid heatmap to depict the relative number of identified neuropeptides under each condition. The initial vertices are denoted by V1, V2, and V3; the subsequent simplexes contain points reflected away from the point of worst performance (R), an elongated reflection (E), a contracted reflection (CR), and the contracted reflection closer to the direction of the worst point (CW).
