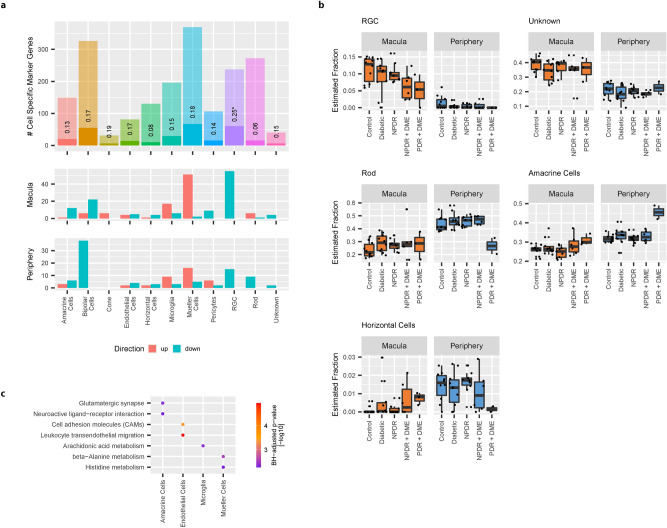
Figure 6.
Cell specific expression of disease-associated RNA: (a) Enrichment of disease-associated genes with cell type specific genes identified from single cell RNASeq data. Barplots indicate the number of cell type specific marker genes identified for each cell type (upper panel). Non-transparent area of bars show the overlap of disease-associated genes (union of DE and DP genes from macula and periphery) with cell type specific marker genes. Middle and lower panel correspond to the direction of expression changes in NPDR/PDR + DME samples vs healthy controls of disease-associated genes (Middle panel: Macula; Lower panel: Periphery). (b) Estimation of cell type abundances from bulk retinal samples using deconvolution. Black dots show predicted fraction of different cell types in each of the bulk retinal samples. Black line indicates the median fraction of different cell types in each disease group. Boxplot lower and upper hinges correspond to the first and third quartiles respectively. Whiskers extend to the largest cell type fraction no further than 1.5 interquartile range from the hinge. Outliers are shown in transparent gray. (c) Enrichment of cell type specific disease-associated genes with molecular pathways. Plot shows significant (Hypergeometric test, BH-adjusted p value < 0.01) associations between cell type specific disease-associated genes and KEGG 2016 pathways. Color indicates BH-adjusted p values [− log10].

