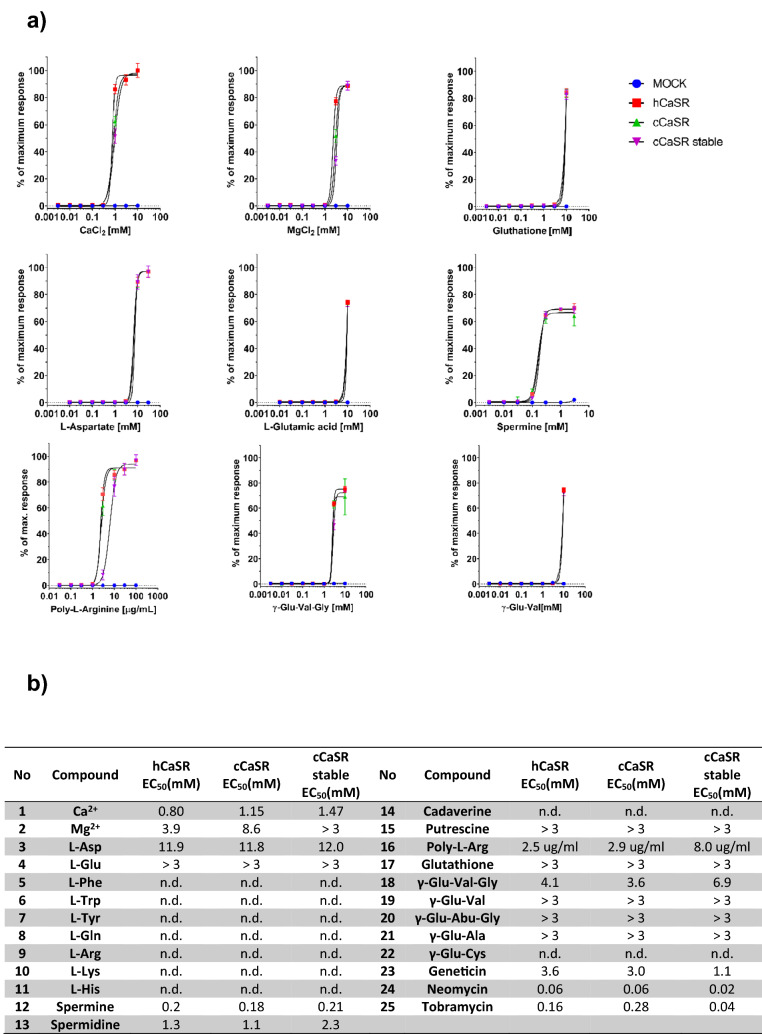
Figure 6.
Both hCaSR and cCaSR bind agonists with similar affinities when expressed in the same cellular system (a). The EC50 values calculated for all the constructs are within similar ranges (b). (a) For each ligand the response of transiently expressed hCaSR (red square) and cCaSR (green triangle) and stably expressed cCaSR (purple triangle) were measured in response to increasing doses of the ligand. The maximal response used to calculate the % of maximal response was measured with CaCl2 at 30 mM. The measurements were made with luminescence, and each point was repeated in two independent measurements, and is represented with ± SEM. In each case, the measurements were made in parallel with cells containing the corresponding CaSR vectors, and cells containing a mock vector (blue circle) to confirm specificity of response. (b) All EC50 values are expressed in mM, except for poly-L-arginine which is expressed in µg/ml. All measurements were repeated over at least three wells on the same assay plate. If the maximal response to a compound was not reached, the EC50 value could not be determined and is expressed as an estimation at > 3 mM.

