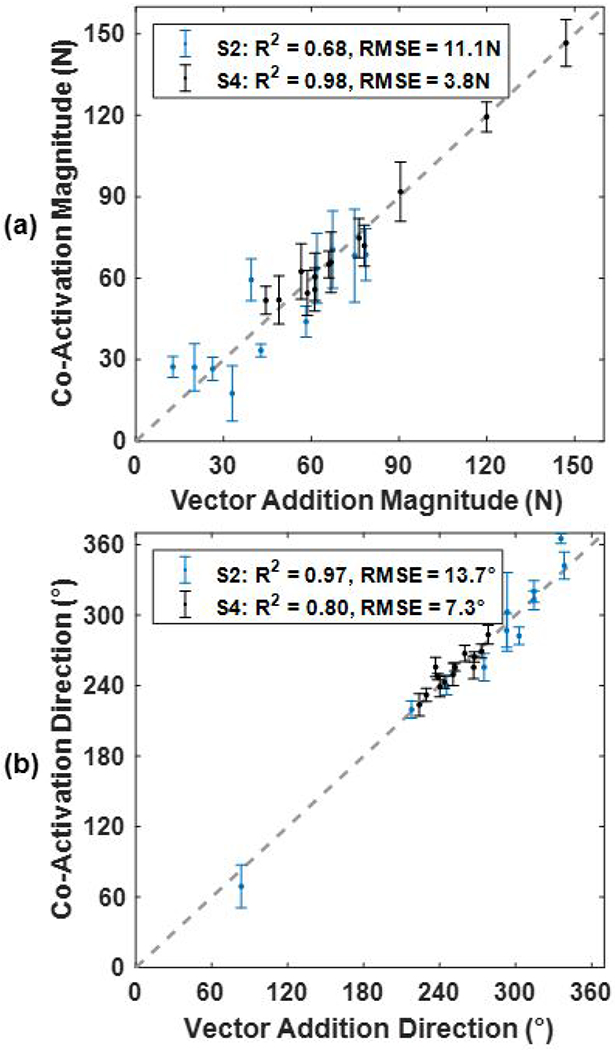
Fig. 6:

Linear regression of the force magnitude (a) and direction (b) of every muscle co-activation compared to the vector addition of the force from each muscle activated alone. The dashed grey line shows the perfect linear addition of muscle forces. Linear fit is accessed, for both S2 and S4, using root-mean-square error (RMSE) and coefficient of deter-mination (R2). Error bars are standard deviation (n=10). A direction of 0° is directly right, 90° is purely anterior, 180° is directly left, and 270° is purely posterior.
