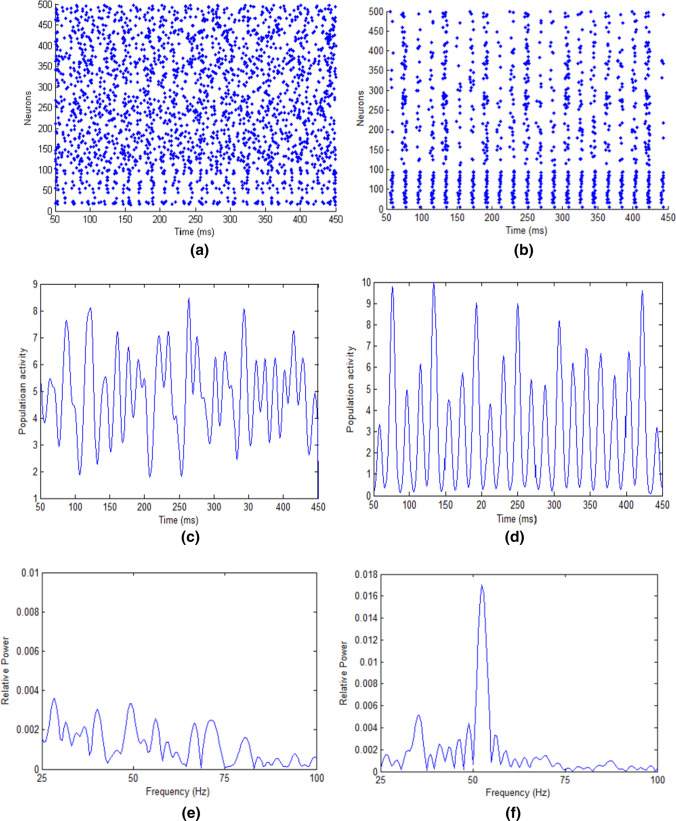
Fig. 1.
Network simulation results (50–450 ms in a 1 s simulation). Neurons indexed 1–100 are inhibitory neurons and neurons indexed 101–500 represent excitatory neurons. a Raster plots of the spiking times of neurons without input difference. b Average population activity without input difference. c The power spectrum of the average population activity without input difference. d Raster plots of the spiking times of neurons with the typical input that S2 is 3.1 and S1 is 2.5 (). e Average population activity with the typical input that S2 is 3.1 and S1 is 2.5 (). f The power spectrum of the average population activity with the typical input that S2 is 3.1 and S1 is 2.5 ()

