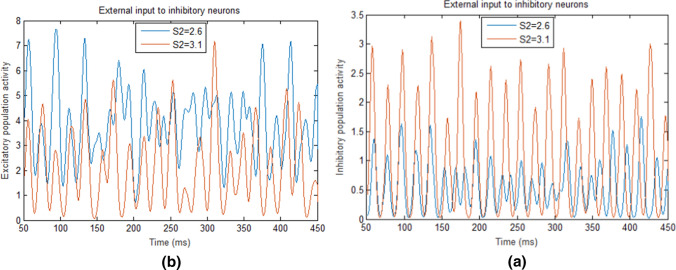
Fig. 4.
E/I population activities in the E/I network with different external inputs to I-neurons (S2). a The activities of the inhibitory population when the external inputs to I-neurons (S2) are 2.6 (blue) and 3.1 (red), respectively. b The activities of the excitatory population when the external inputs to I-neurons (S2) are 2.6 (blue) and 3.1 (red), respectively. (Color figure online)

