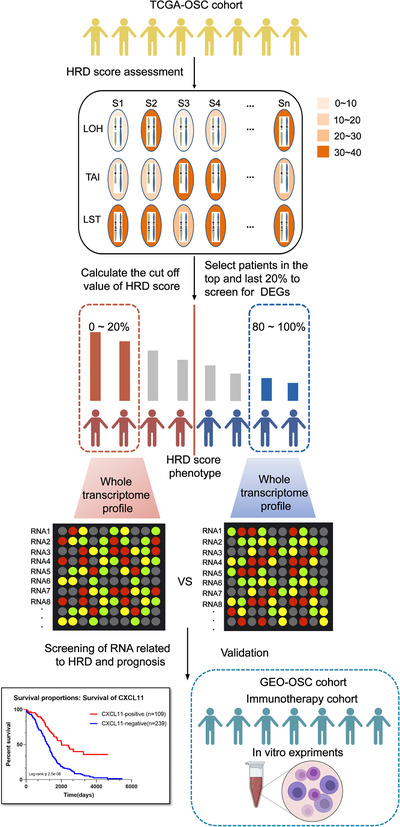
FIGURE 1.

Computational overview of homologous recombination deficiency (HRD)‐related RNAs detection. Columns reflect ovarian cancer samples, and the rows reflect three biomarkers of the HRD score. Color reflects the scores for each biomarker in each sample. HRD‐related RNAs were detected by comparing the RNA expression profile between the top 20% patients with high HRD scores and the bottom 20% patients with low HRD scores
