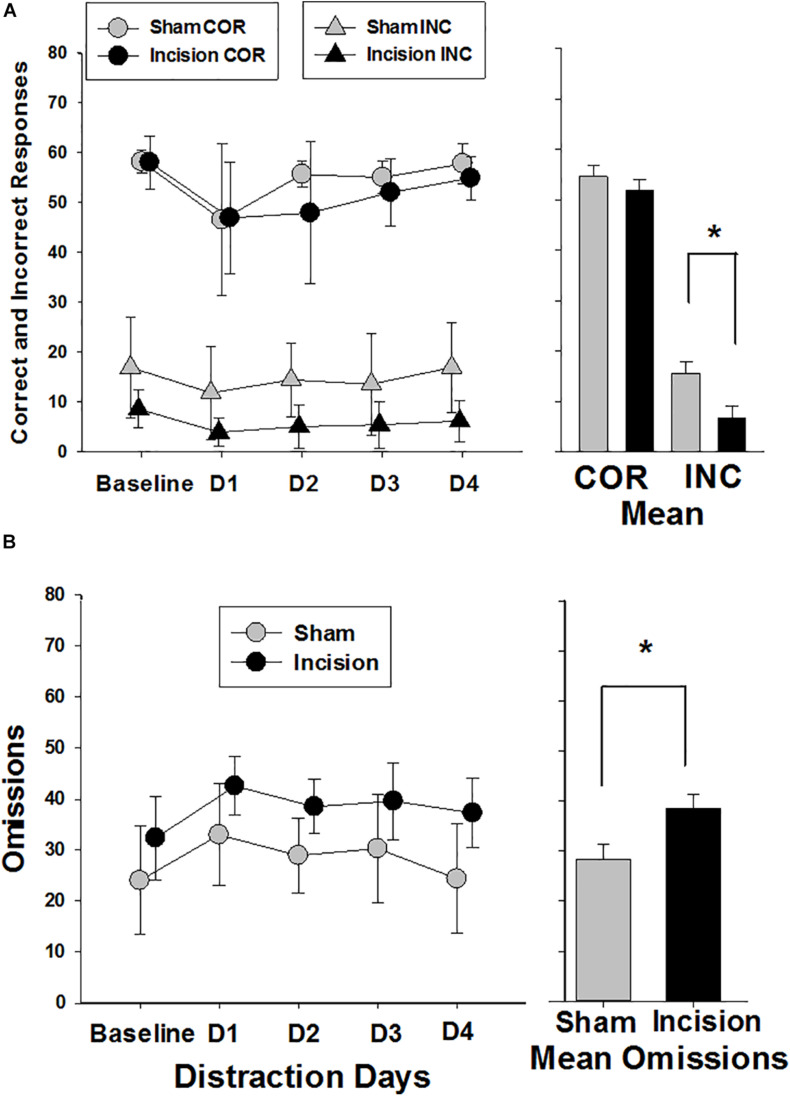
FIGURE 6.
Correct, Incorrect and Omission Responses during the attention trials. Responses are shown for sham (N = 8) and incision and anesthesia animals (N = 8). (A) Correct responses are shown at the top of the graph (circles). No difference in baseline correct response between sham and incision was present (unpaired t-test). Distraction decreased correct responses in both incision and sham with no difference between groups (two way repeated measures ANOVA). The bar graph shows no significant difference between correct group means. Incorrect responses are shown at the bottom of the graph (triangles). No difference in baseline incorrect response between sham and incision was present (unpaired t-test). Distraction decreased incorrect responses in both incision and sham with a significant difference between groups (two way repeated measures ANOVA). The bar graph shows a significant difference between incorrect group means. (B) Response omissions are shown with no difference in baseline omission responses between sham and incision (unpaired t-test). Distraction increased omissions in both incision and sham with an overall difference between groups (two way repeated measures ANOVA). The bar graph shows a significant difference between omission group means. Data are presented as means and standard deviation and bar graphs are group means and standard error of the mean. *p < 0.05 between groups.

