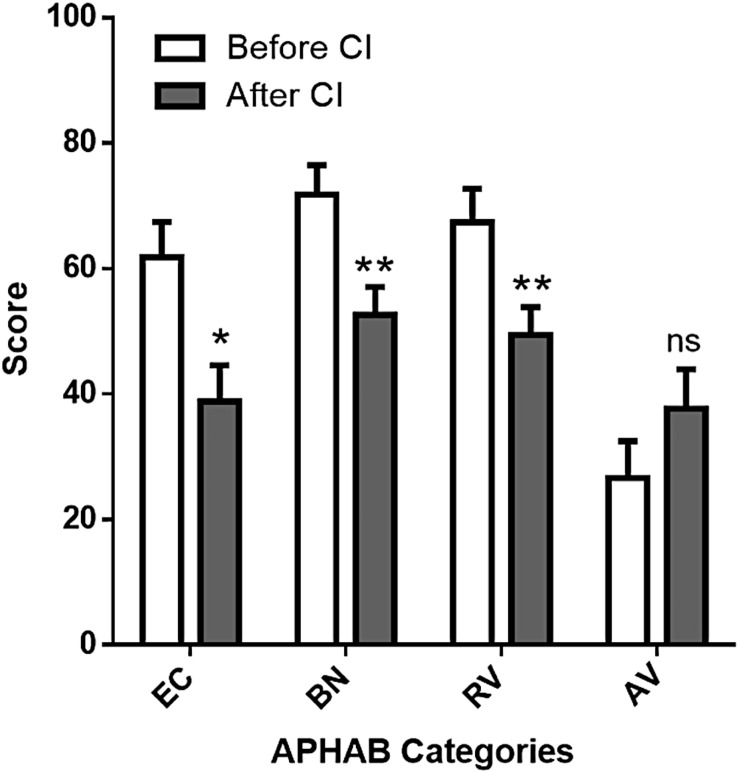
FIGURE 3.
APHAB scores before and after cochlear implantation. Values are represented as mean ± standard error of mean for each subdomain: ease of communication (EC), background noise (BN), reverberation (RV), aversiveness (AV). Lower scores indicate better functional results. ns, not significant. *Adjusted p-value < 0.05, two-way ANOVA followed by a Sidak’s test for multiple comparison.

