
FIGURE 3.
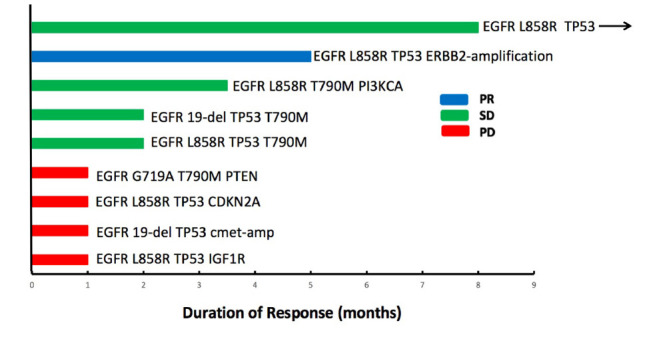
Individual duration of combined treatment in patients with post-osimertinib/pre-combined biopsies. Patients who developed a progressive disease are denoted in red, stable disease in green, and partial response in blue. Arrows indicate patients continuing on the combination of apatinib and osimertinib at the time of last follow-up.