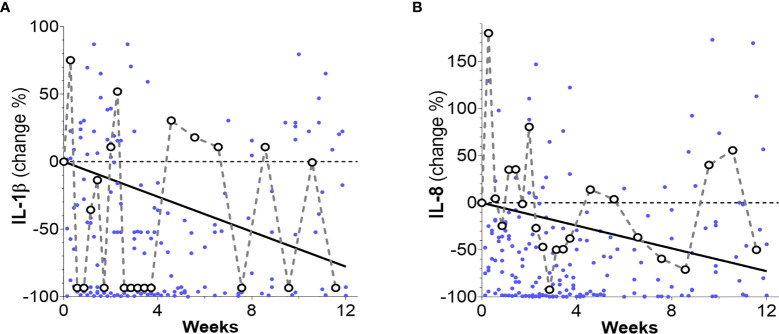
Figure 3.
Percentage changes of patients’ inflammation markers levels (dots) and their overall time trends as obtained from linear mixed-effects models. (A) An overall decreasing trend for IL-1β is observed (solid line) over the whole 12-week time period (slope: -0.19 ± 0.09 pg/mL week, p = 0.042 and intercept 2.95 ± 0.49 pg/mL, p < 0.001). (B) An overall decreasing trend (solid line) was observed for IL-8 (slope: -11.48 ± 5.86 pg/mL week, p = 0.049 and intercept 189.76 ± 32.20 pg/mL, p < 0.001). Notice that for clarity, 16 data points surpassing the 100% level in (A) and 5 data points surpassing the 200% level in (B) are not shown.

