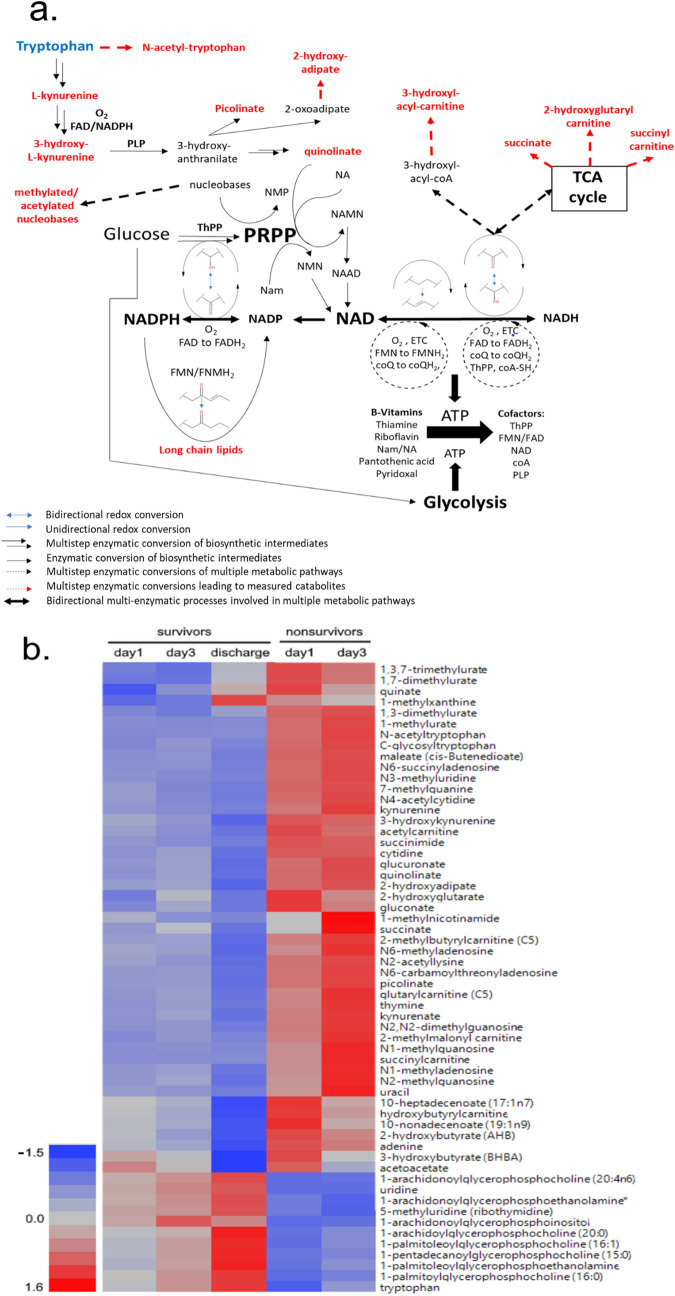
Figure 1.
ARF leads to dysregulated NAD metabolism in nonsurvivors. (A) Pathway analysis of bioenergetic changes in ARF nonsurvivors. A loss of functional levels of PRPP due to a decline in the levels of functional B-vitamin derived cofactors and nucleotides can explain the accumulation of catabolites (red) observed to greatly differ between survivors and nonsurvivors. (B) Ward hierarchical cluster heat map of dysregulated bioenergetic metabolites in ARF nonsurvivors. Concentration of metabolites is depicted by least-squares means with red being increased concentration and blue as reduced concentration in the serum. Metabolites for presentation were selected as representatives of the primary affected pathways represented in 1A. Heatmap made utilizing JMP Genomics 8.0, https://www.jmp.com/en_us/software/genomics-data-analysis-software.html. NAD: nicotinamide adenine dehydrogenase; NAMN: nicotinic acid mononucleotide; NMN: nicotinamide mononucleotide; NAAD: nicotinic acid adenine dinucleotide; ETC: electron transport chain; TCA: tricarboxylic acid; NMP: ribonucleoside monophosphate; ThPP: thiamine pyrophosphate; FMN: flavin monophosphate; FMNH2: flavin mononucleotide reduced form; FAD: flavin adenine dinucleotide; FADH2: flavin adenine dinucleotide reduced form; coA-SH: coenzyme-A; PLP: phosphopyridoxal; coQ: coenzyme Q; CoQH2: coenzyme Q, reduced form.

