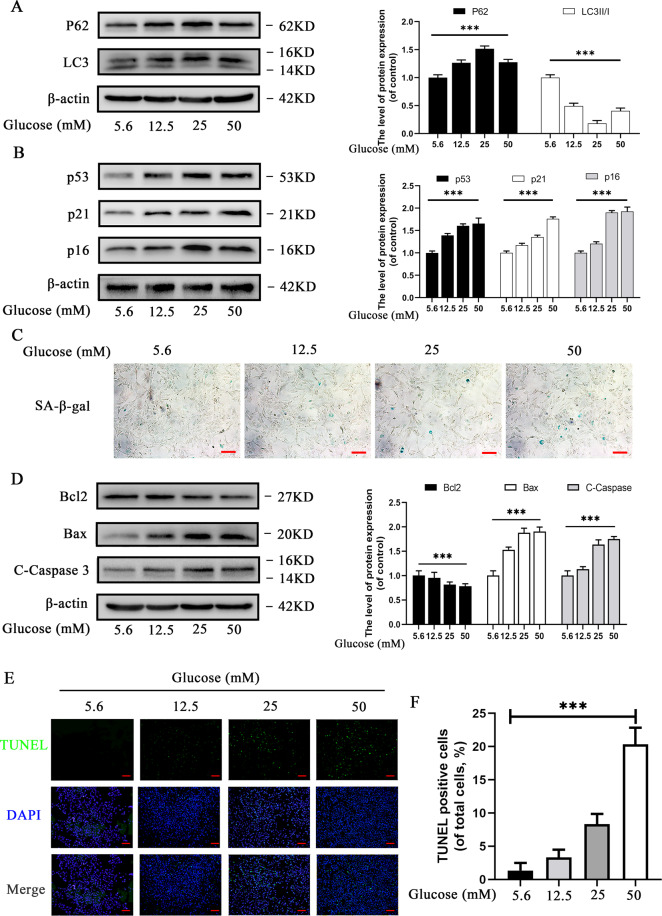
Fig. 1. Effects of high glucose (5.6, 12.5, 25, and 50 mM) on autophagy, apoptosis, and senescence in chondrocytes.
A Western blot results and quantification analyses of p62, and LC3 in chondrocytes under various glucose concentrations. B Western blot results and quantification analyses of p53, p21, and p16 treated with various glucose concentrations. C Representative micrographs of SA-β-gal staining representing the effects of glucose on senescence. Scale bar 100 μM. D Western blot results and quantification analyses of Bcl2, Bax, and cleaved caspase-3 treated with various glucose concentrations. E Representative micrographs of TUNEL staining representing the effects of glucose on apoptosis. F TUNEL-positive cell intensity under various glucose concentrations. Scale bar = 200 μM. Data are presented as means ± SD (n = 5). *P < 0.05, **P < 0.01, and ***P < 0.001.

