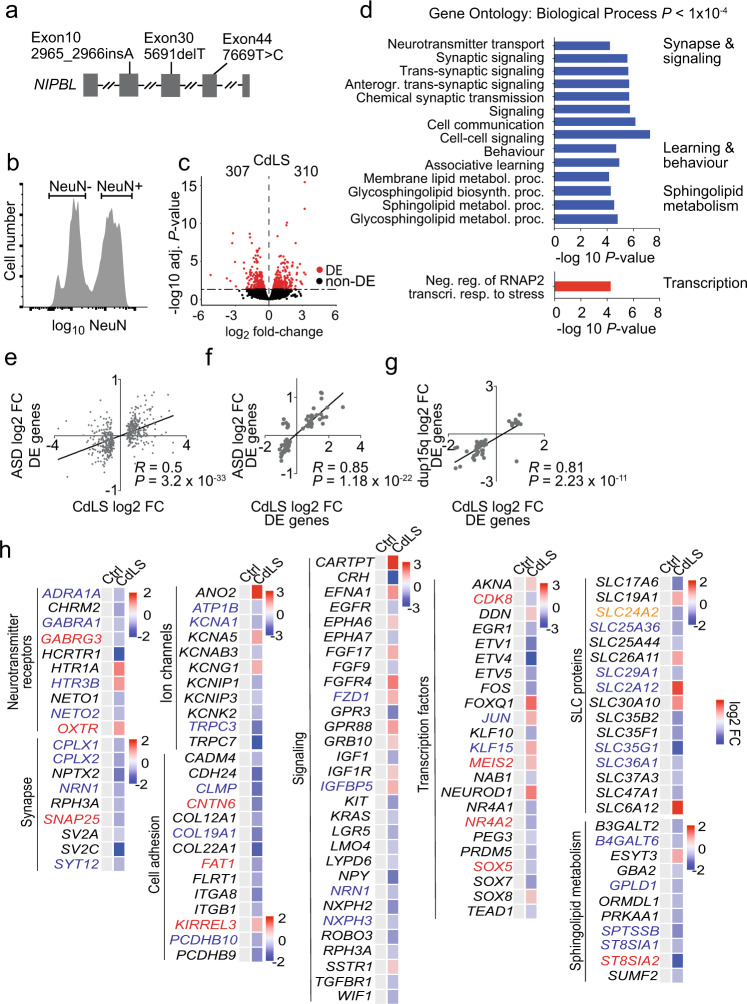
Fig. 1. CdLS patient brains display abnormal neuronal gene expression.
a NIPBL mutations in CdLS patients. b Flow cytometry histogram of NeuN-stained nuclei from post-mortem tissue. Sort gates for NeuN-positive and -negative nuclei are indicated. c Volcano plot of gene expression fold-change versus adjusted P value of NeuN-positive nuclei from CdLS patients (n = 4). 307 genes were down- and 310 genes were upregulated (RUVg k = 2, adj. P < 0.05, Wald Test, Benjamini-Hochberg adjusted). Differentially expressed (DE) genes are shown in red. d Bar graph of individual GO terms and broad categories (P < 1 × 10⁻⁴, Wallenius approximation). Terms represented by downregulated genes are shown in blue, those by upregulated genes in red. e Scatter plot of gene expression comparing log2 fold-change of differentially expressed genes (adj P < 0.05) in idiopathic ASD, and the same genes in NeuN-positive CdLS samples. (R = Pearson correlation coefficient; P = 3.2e-33, two-sided F test). f Scatter plot of log2 fold-change of shared deregulated genes (adj P < 0.05) in both ASD and NeuN-positive CdLS samples. (R = Pearson correlation coefficient; P = 1.18e-22, two-sided F test). g Scatter plot of log2 fold-change of genes that were deregulated in both duplication of chromosome 15q.11.2-13.1 (dup15q) and NeuN-positive CdLS samples. (R = Pearson correlation coefficient; P = 2.23e-11, two-sided F test). h Heatmap of log2 fold-changes for deregulated genes in NeuN-positive CdLS samples. Genes are grouped by functional categories. Genes highlighted in red are in the SFARI database41, those in blue were deregulated in ASD and/or dup15q, genes highlighted in orange meet both criteria.

