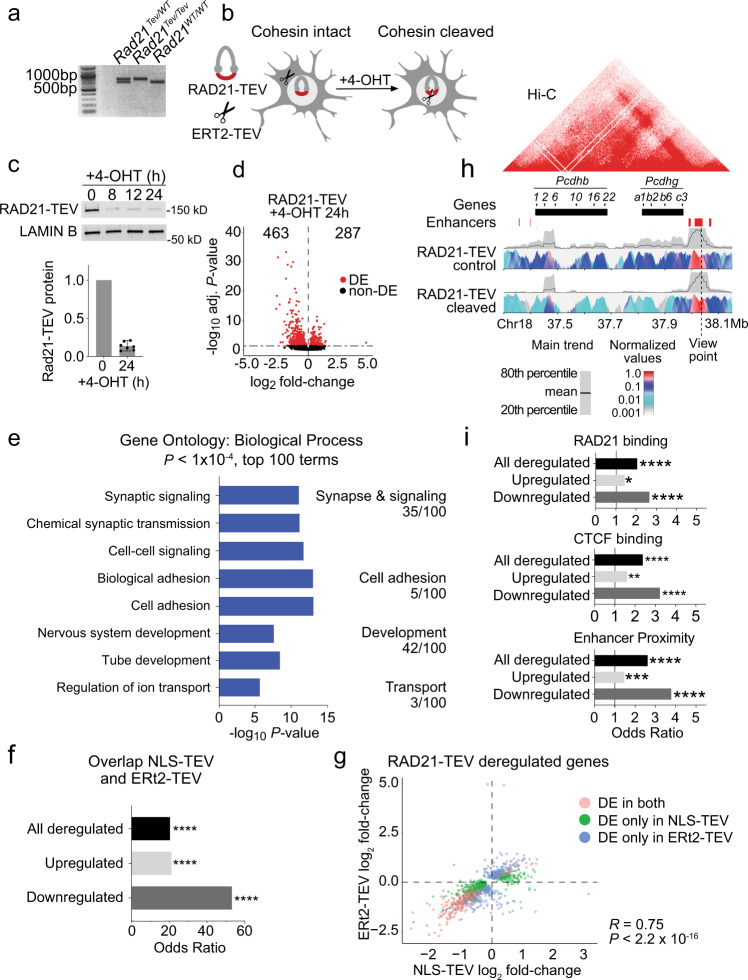
Fig. 2. Cohesin is continuously required to sustain neuronal gene expression.
a PCR analysis of Rad21 alleles from Rad21Tev/WT, Rad21Tev/Tev and Rad21WT/WT mice. b Schematic of ERt2-TEV-dependent RAD21-TEV degradation. c Western blot of RAD21-TEV protein expression over a time course of 4-OHT treatment. Bar plot of RAD21-TEV protein expression normalized to LAMIN B (n = 7, h = hours). d Volcano plot of gene expression fold-change versus adjusted P value in RNA-seq of RAD21-TEV neurons transduced with ERt2-TEV and treated with 4-OHT for 24 h (n = 3). A total of 463 genes were down- and 287 genes were upregulated (adj P < 0.05, Wald Test, Benjamini-Hochberg adjusted). Differentially expressed (DE) genes are shown in red. e Bar graph of individual GO terms and broad categories (P < 1 × 10⁻⁴, Wallenius approximation) in RNA-seq of RAD21-TEV neurons treated as in (d). Terms represented by downregulated genes are shown in blue. Upregulated genes showed no GO term enrichment at P < 1 × 10⁻⁴. f Enrichment of shared deregulated genes (adj P < 0.05) in response to acute cohesin depletion induced by ERt2-TEV and NLS-TEV. One-sided Fisher’s exact test was applied for the odds ratio and P value. All comparisons P < 2.22e-16. g Scatter plot of gene expression, comparing log2 fold-change of deregulated genes (adj P < 0.05) in response to acute cohesin depletion induced by ERt2-TEV and NLS-TEV (DE differentially expressed, R = Pearson correlation coefficient; P < 2.2e-16, two-sided F test). h 4 C analysis of chromatin interactions at the Pcdhb locus. Top: Hi-C representation of domain structure at the Pcdhb locus in mouse cortical neurons95, with selected genes and enhancers. Bottom: contact profiles of enhancers HS18-20 in control cells (top panel) and RAD21-TEV cleaved cells (bottom panel). A dashed line indicates the enhancer site and viewpoint. A grey band displays the 20th to 80th percentiles and the black line within shows mean values for 40 kb windows. The colour panel shows the mean contact intensities for multiple window sizes from 2 kb to 5 kb for n = 4 independent biological replicates. All replicates showed comparable results and were merged to generate this figure. i Genes significantly deregulated (adj P < 0.05) by ERt2-TEV mediated RAD21-TEV degradation are enriched for the binding of cohesin (top) CTCF (center) and proximity to neuronal enhancers (bottom, see methods). One sided Fisher’s exact test was applied for the odds ratio and P value. *P < 0.05, **P < 0.01, ***P < 0.001, ****P < 0.0001.

