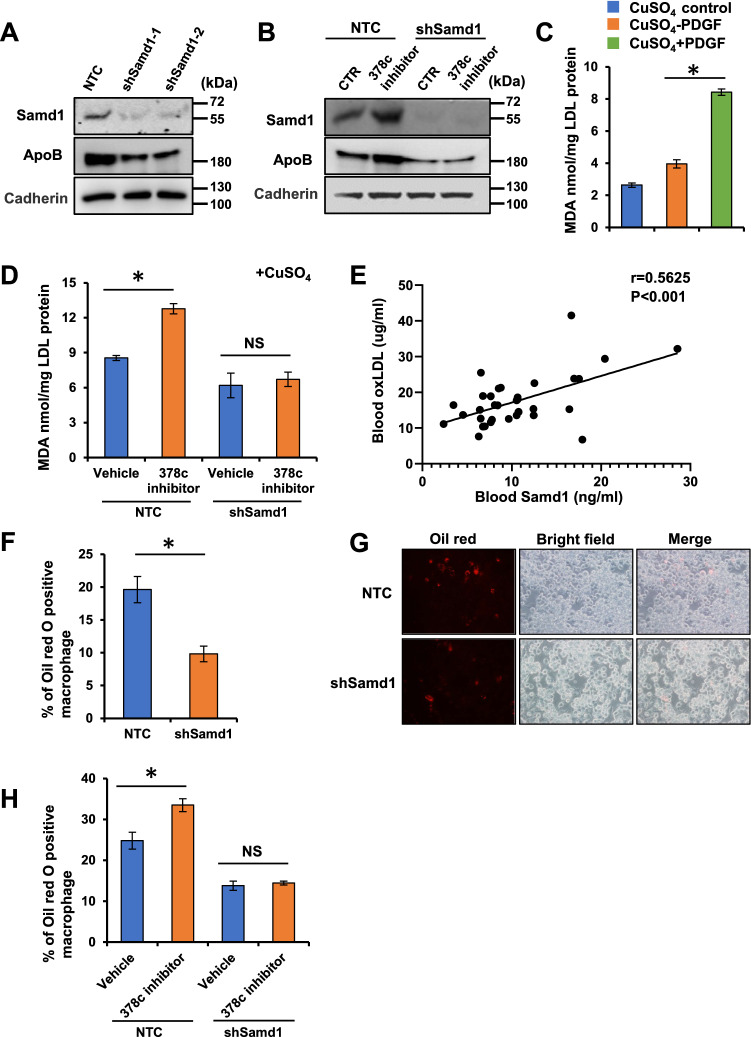
Figure 6.
Samd1 facilitates LDL oxidation and foam cell formation. (A) VSMCs stimulated with PDGF-BB were further transfected with Samd1 shRNA or NTC and cultured with LDL, membrane Samd1 and ApoB were analyzed by western blot. Cadherin serves as a loading control. (B) VSMCs treated with PDGF-BB and miR-378c inhibitor were further transfected with Samd1 shRNA or NTC and cultured with LDL, membrane Samd1 and ApoB were analyzed by western blot. Cadherin serves as a loading control. (C) VSMCs were stimulated with PDGF-BB and cultured with LDL. TBARS assay showing oxLDL formation. Data were presented as mean ± SD, n = 4. *P < 0.05 as compared with non-PDGF treated group. (D) VSMCs treated with PDGF-BB and miR-378c inhibitor were further transfected with Samd1 shRNA or NTC and cultured with LDL, followed by TBARS assay analysis of oxLDL formation. Data were presented as mean ± SD, n = 4. *P < 0.05 as compared between the indicated group. (E) Correlation between blood oxLDL level and blood Samd1 protein level. n = 30. Statistical significance was determined by the chi-square test. (F,G) VSMCs stimulated with PDGF-BB were further transfected with Samd1 shRNA or NTC and cultured with LDL, supernatants were collected and added to mouse bone-marrow-derived macrophages (BMDM) to induce foam cells formation. Oil red positive cells were counted. Data were presented as mean ± SD, n = 4. *P < 0.05 as compared PDGF-treated NTC group. (H) Supernatants from panel (E) were collected and added to BMDM to induce foam cells formation. Oil red positive cells were counted. Data were presented as mean ± SD, n = 4. *P < 0.05 as compared between the indicated group.

