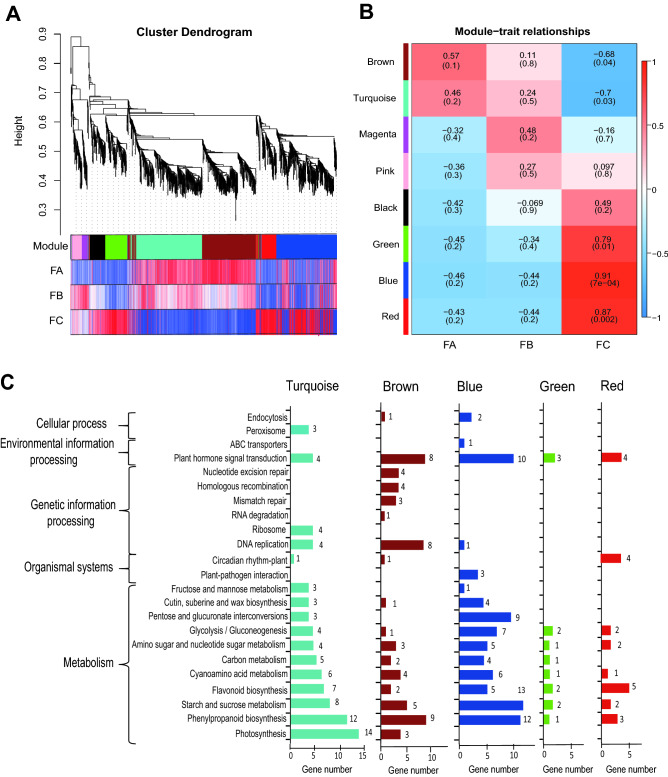
Figure 3.
Weighted correlation network analysis (WGCNA) of co-expressed transcripts. (A) Hierarchical clustering tree showing co-expression modules based on WGCNA analysis. Each branch in the phylogenetic tree corresponds to an individual gene, and highly interconnected genes are grouped into seven modules. The different colored rows below the phylogeny indicate differentially expressed transcripts in G. luofuense. (B) Module–trait relationship with physiological indexes. The number represents the correlation coefficient about modules with physiological indexes. The number in the bracket means p-value (C) KEGG (Kyoto Encyclopedia of Genes and Genomes) pathway annotations of co-expressed genes in the largest five modules.

