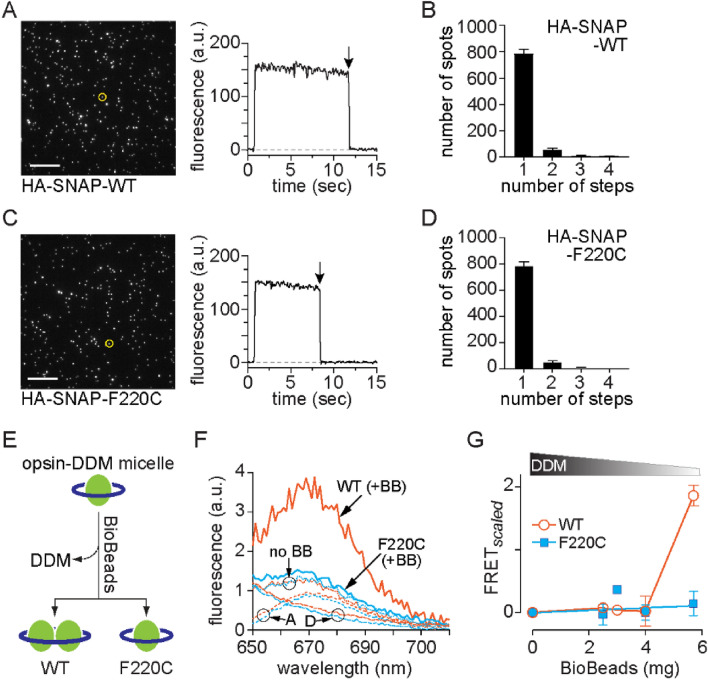
Figure 1.
Dimerization of WT opsin, but not F220C opsin, in a micellar system. (A–D) SiMPull experiments with HA-SNAP-WT opsin (A,B) and HA-SNAP-F220C opsin (C,D). Opsin constructs were expressed in HEK293T cells and labeled using a membrane-impermeant SNAP fluorophore (LD555). The cells were solubilized in DDM and the proteins were captured on glass slides coated with anti-HA antibodies for visualization of fluorescence by TIRF microscopy (A,C). Bleaching of individual spots was recorded; traces for representative spots (circled in the fluorescence images) are shown, with arrows to indicate the bleaching step, and the number of spots that bleached in 1, 2, 3 or 4 steps was quantified (B,D). We note that as fluorophore bleaching is a stochastic process, the time taken for an individual spot to bleach is arbitrary. (E) Schematic of the effect of detergent removal on the quaternary structure of WT and F220C opsins. (F) Emission spectra (λex = 555 nm) for donor (D)-acceptor (A) pairs of WT (orange) or F220C opsin (blue) treated with 5.7 mg Bio-Beads (+ BB, solid lines) or mock-treated (no BB, dotted lines). Spectra of mock treated samples of acceptor alone and donor alone ('A' and 'D', dashed lines) are also shown. Sensitized emission of the acceptor (λex = 555 nm, λem = 670 nm) indicates FRET as seen in the BioBead-treated WT sample (+ BB). (G) FRET was quantified after extracting increasing amounts of DDM (shown schematically above the graph) by treating samples with different amounts of Bio-Beads. A FRET measure (FRETscaled) was obtained by calculating the ratio of the emission intensity at 670 nm for D-A mixtures relative to the acceptor-only sample, followed by an offset correction corresponding to mock-treated samples (no BB, A). Data are mean ± SEM (n ≥ 3) and connecting lines are drawn to guide the eye.

