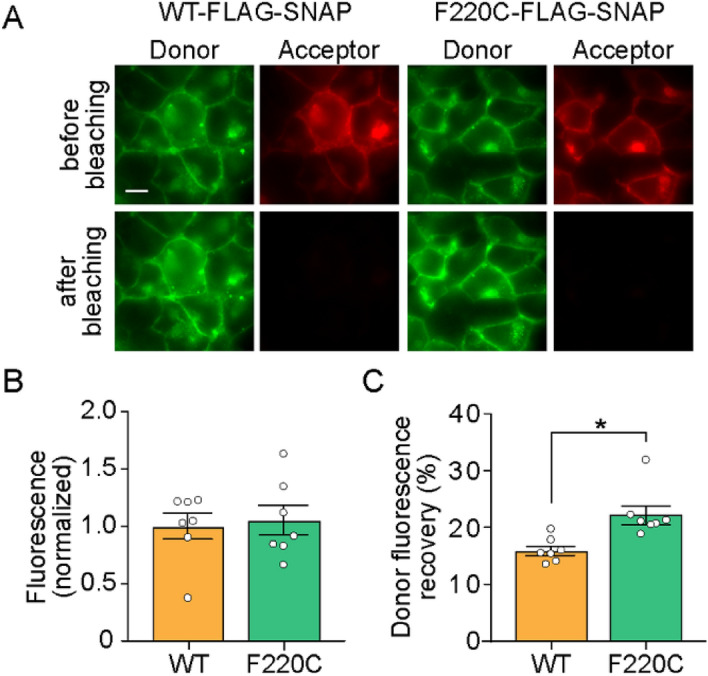
Figure 10.

Distinct dimer conformations of WT and F220C opsins in the plasma membrane of HEK293 cells. (A) Fluorescence images of HEK293 cells expressing WT-FLAG-SNAP opsin and F220C-FLAG-SNAP opsin labeled with SNAP donor (BG-JF549) and acceptor (BG-JF646) dyes. The top and bottom rows show images of cells taken before and after bleaching of the acceptor by high intensity 640 nm illumination. Scale bar, 10 μm. (B) Summary of acceptor fluorescence as a reporter of comparable surface expression for both constructs. (C) Summary of donor fluorescence recovery upon acceptor bleaching, indicative of FRET (*, p = 0.007, unpaired t-test (two-tail)).
