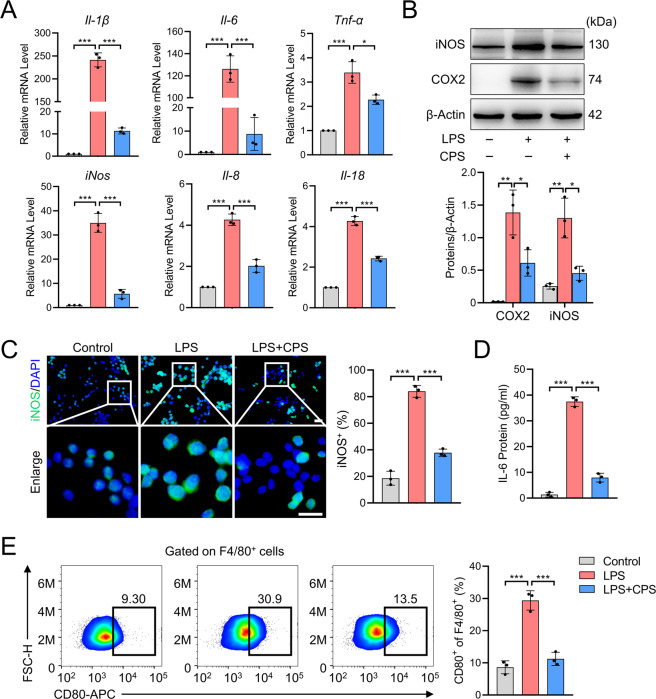
Fig. 3. TRPV1 inhibits M1 macrophage polarization in RAW264.7 cells.
A qPCR analysis of mRNA levels of M1 macrophage markers in the cells treated with LPS with or without CPS for 24 h. B Western blot and quantitative analysis of iNOS and COX2 proteins in the cells treated with LPS with or without CPS for 48 h. C Immunofluorescence and quantitative analysis of iNOS in RAW264.7 cells treated with LPS with or without CPS for 48 h. D ELISA analysis of IL-6 levels in the supernatant of the culture medium of RAW264.7 cells treated with LPS with or without CPS for 48 h. E Flow cytometry for detection and quantitative analysis of F4/80+CD80+ cells after the treatment of LPS with or without CPS for 48 h. Data (n = 3) are shown as mean ± SD. *P < 0.05; **P < 0.01; ***P < 0.001. Scale bars: 25 μm.

