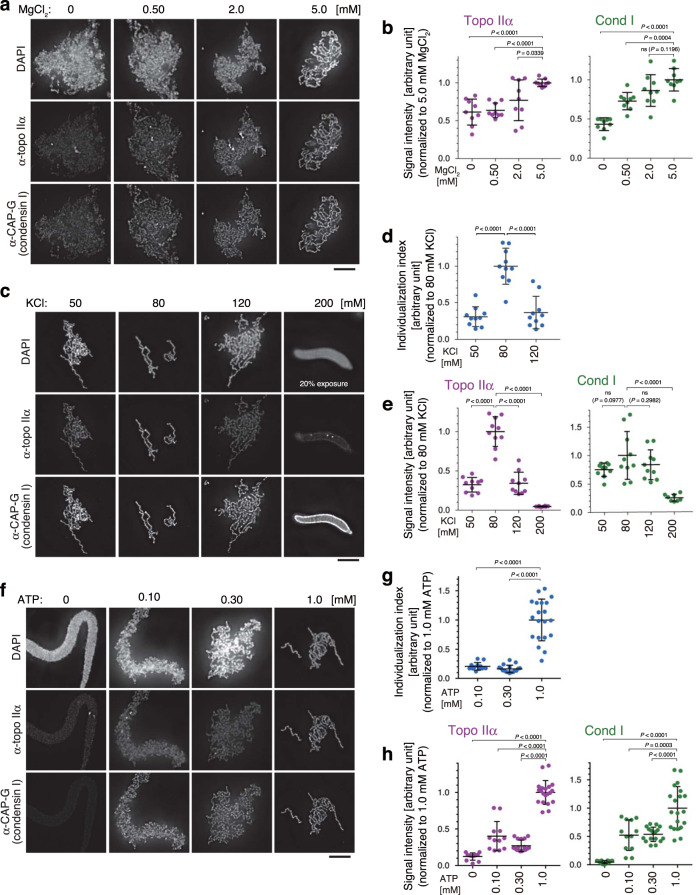
Fig. 1. Manipulation of buffer conditions in the mitotic chromatid reconstitution assay.
a, b Xenopus sperm nuclei were mixed with a cocktail of six purified proteins (topo IIα, condensin I, a truncated version of histone H2A.XF-H2B dimer, Npm2, Nap1, and FACT) in a buffer containing no MgCl2 or increasing concentrations of MgCl2. The concentrations of other chemical ingredients in the buffer are listed in Table 1. After a 150-min incubation at 22 °C, the resultant structures were fixed and labeled with antibodies against topo IIα and CAP-G (a subunit of condensin I). DNA was counterstained with DAPI (a). Integral signal intensities of topo IIα or CAP-G were divided by those of DAPI in the same segmented region, and the values normalized to the average value in the reaction containing 5.0 mM MgCl2 are plotted. The mean ± s.d. is shown (n = 9 clusters of chromatin). P values were assessed by two-tailed Welch’s t-test (ns, not significant) (b). c–e KCl concentrations were titrated in the reconstitution assay. Immunolabeling and signal quantification were carried out as above (c, e). The perimeter of a DAPI-positive segmented area was divided by the integral intensity of DAPI in the same area, and the resultant values are plotted as individualization indices (d). The mean ± s.d. is shown. The sample sizes (n, the number of clusters of chromatin) are 10 (50, 80, and 120 mM KCl) and 8 (200 mM KCl). P values were assessed by two-tailed Welch’s t-test (ns, not significant) (d, e). f–h ATP concentrations were titrated in the reconstitution assay (f). Individualization indices and signal intensities were analyzed as above. The mean ± s.d. is shown. The sample sizes (n, the number of clusters of chromatin) are 12 (0 and 0.10 mM ATP), 17 (0.30 mM ATP) and 20 (1.0 mM KCl). P values were assessed by a two-tailed Welch’s t-test. ns not significant (g, h). Bars, 5 µm.

