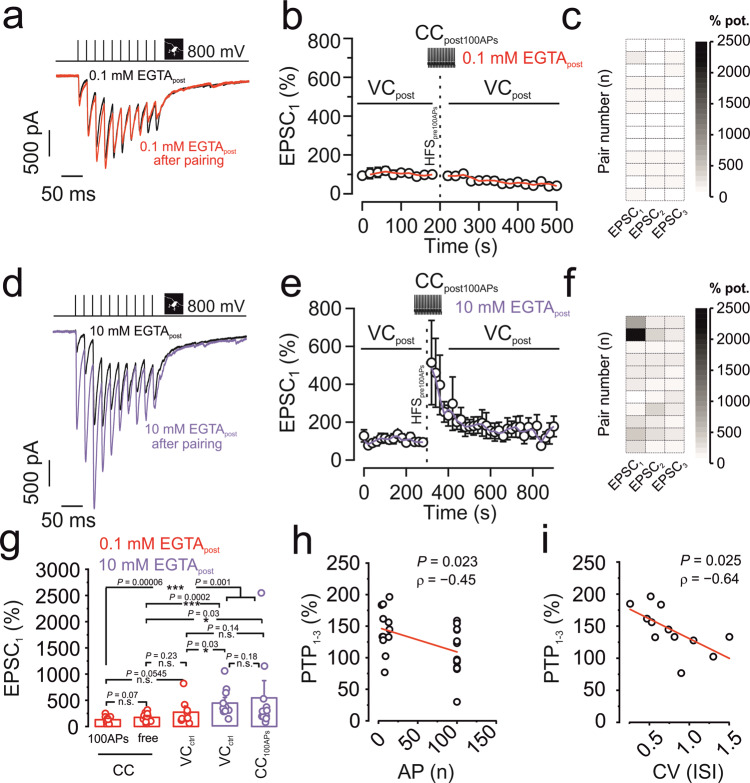
Fig. 2. Anti-associative induction properties of mossy fiber PTP.
a–c Pre + post HFS100 fails to induce PTP with 0.1 mM EGTA in the postsynaptic pipette. a Representative traces of control (black) and after HFS100 pairing (red). b Normalized EPSC1 amplitude plotted versus experimental time. Black vertical dashed line indicates delivery of an HFS100 stimulation (1 s, 100 Hz) in tight-seal cell-attached mode at the level of the MFB, combined with pairing 100 postsynaptic APs in current-clamp mode. Red line shows running average. Data from 13 pairs. c Intensity map showing the degree of potentiation of the first three EPSCs (in %, with control values plotted as 100%) of each single pair between an MFB and a CA3 pyramidal cell, upon pairing with 0.1 mM EGTA in the postsynaptic pipette. d–f Pre + post HFS100 triggers full PTP with 10 mM EGTA in the postsynaptic pipette. d Representative traces of control (black) and after HFS100 pairing (violet). e Normalized EPSC1 amplitude plotted versus experimental time. Black vertical dashed line indicates delivery of an HFS100 stimulation (1 s, 100 Hz) in tight-seal cell-attached mode at the level of the MFB, combined with pairing 100 postsynaptic APs in current-clamp mode. Violet line shows running average. Data from 11 pairs. f Intensity map showing the degree of potentiation of the first three EPSCs (in %) of each MFB–CA3 pyramidal neuron pair, with 10 mM EGTA postsynaptically. g Summary bar graphs showing the percentage of potentiation of EPSC1 by pairing 100 presynaptic APs with or without postsynaptic APs with different concentrations of the Ca2+ chelator EGTA. Red bar graphs represent pairs where 0.1 mM EGTA was included in the postsynaptic pipette. Violet bar graphs represent pairs where 10 mM EGTA was included in the postsynaptic pipette. CC100APs refers to a–c and d–f (above). CCfree refers to experiments where the postsynaptic cell was allowed to spike freely in current-clamp mode upon presynaptic HFS100. VCctrl in the presence of 10 mM EGTA refers to data published in Vandael et al.10, where the postsynaptic cell was under voltage-clamp control to prevent spiking. Boxes represent mean values, and circles show individual measurements. A non-paired non-parametric two-sided Mann–Whitney U test was used to test for statistical significance. * indicates P < 0.05, ** P < 0.01, *** P < 0.001, and n.s. denotes non-significant difference (P ≥ 0.05). P values are given without multiple comparison correction. Data from 13, 12, 9, 12, and 11 pairs. h Scatter plot of magnitude of PTP against number of APs of the postsynaptic CA3 pyramidal neuron. The degree of PTP refers to the average PTP obtained for the first three EPSCs (EPSC1–3). Note a significant correlation. Line represents linear regression to the data points (Pearson’s correlation coefficient ρ = −0.45; P = 0.023; 25 pairs; 13 with CC100APs and 12 with CCfree). i Scatter plot of magnitude of PTP against coefficient of variation (CV) of ISI duration of the postsynaptic CA3 pyramidal neuron. The degree of PTP refers to the average PTP obtained for the first three EPSCs (EPSC1–3). Data points taken from postsynaptic CCfree recordings upon presynaptic HFS100. Note a significant correlation. Line represents linear regression to the data points (Pearson’s correlation coefficient ρ = −0.64; P = 0.025; 12 pairs). Error bars indicate SEM.

