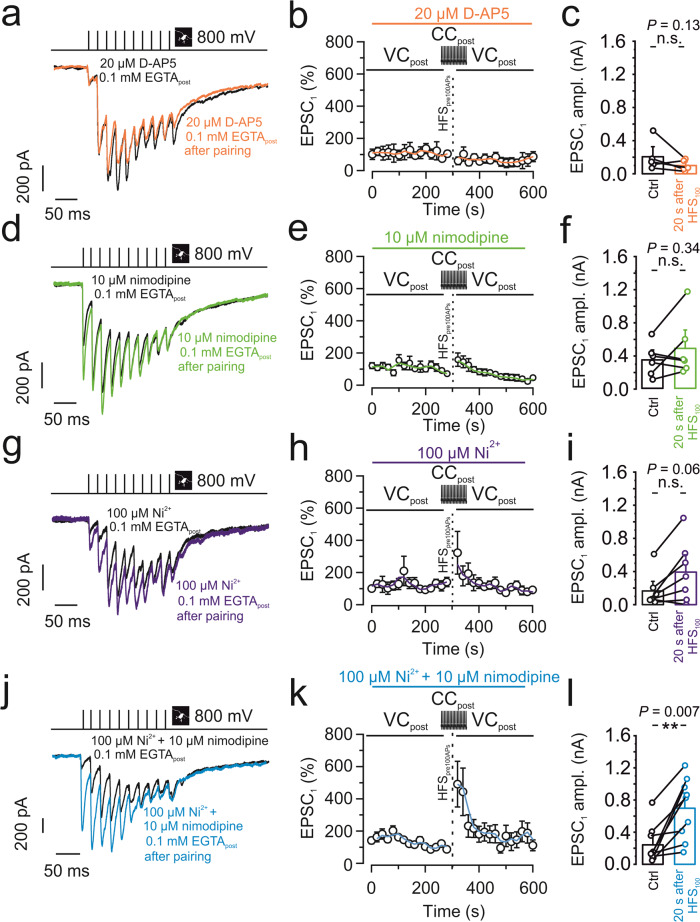
Fig. 3. Anti-associative PTP involves postsynaptic Ca2+ inflow deriving from R- and L-type Ca2+ channels.
a–c 20 µM D-AP5 did not restore PTP after pairing 100 presynaptic APs with postsynaptic APs with 0.1 mM EGTA in the postsynaptic pipette. a Representative traces of control (black) and after PTP induction (orange). b Normalized EPSC1 amplitude plotted against experimental time. Black vertical dashed line indicates PTP induction, pairing HFS100 stimulation (1 s, 100 Hz) in the presynaptic terminal (tight-seal cell-attached mode) with spiking in the postsynaptic neuron (whole-cell current-clamp configuration). Orange line shows running average. Orange horizontal bar on top indicates the application period of the NMDA receptor blocker D-AP5. c Summary bar graph showing the EPSC1 amplitude before (“Ctrl”; black) and after pairing 100 presynaptic APs with postsynaptic APs (“20 s after HFS100”; orange) in the presence of 20 µM D-AP5. d–f Similar experiments as shown in a–c, but with 10 µM of the L-type Ca2+ channel blocker nimodipine (green). Nimodipine alone did not restore PTP. g–i Similar experiments as shown in a–c, but with 100 µM of the T-type and R-type Ca2+ channel blocker Ni2+ (purple). Ni2+ led to a trend towards recovery of PTP. j–l Similar experiments as shown in a–c, but with 10 µM of the L-type Ca2+ channel blocker nimodipine and 100 µM of the T- or R-type Ca2+ channel blocker Ni2+ (blue). Combined application of the Ca2+ channel blockers largely restored PTP. c, f, i, l Boxes represent mean values, and circles show individual measurements. A paired non-parametric two-sided Wilcoxon signed rank test was used to test for statistical significance. ** indicates P < 0.01, and n.s. denotes non-significant difference (P ≥ 0.05). Data in (b, c), (e, f), (h, i), and (k, l) are from 5, 6, 7, and 9 pairs, respectively. Error bars indicate SEM.

