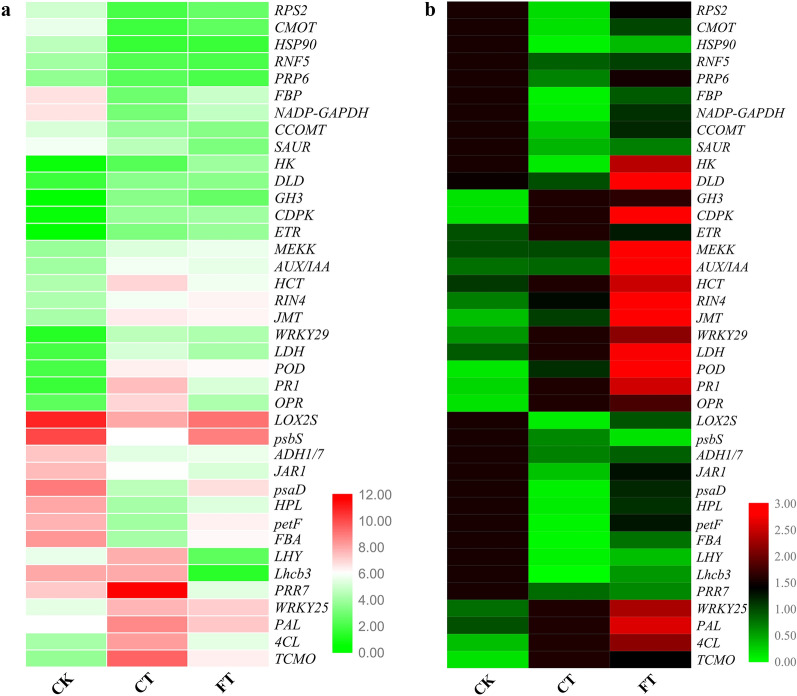
Figure 9.
DEGs screening by FPKM value and qRT-PCR analysis. (a) The map shows the change in FPKM value of selected DEGs in CK, CT and FT treatments. Each column represents a given treatment and each row indicates relative expression or FPKM value of the gene written on the right side. (b) Heat map showing the relative expression of selected DEGs in CK, CT and FT conditions as measured through qRT-PCR. Gene abbreviations are being expanded in Table 5.

