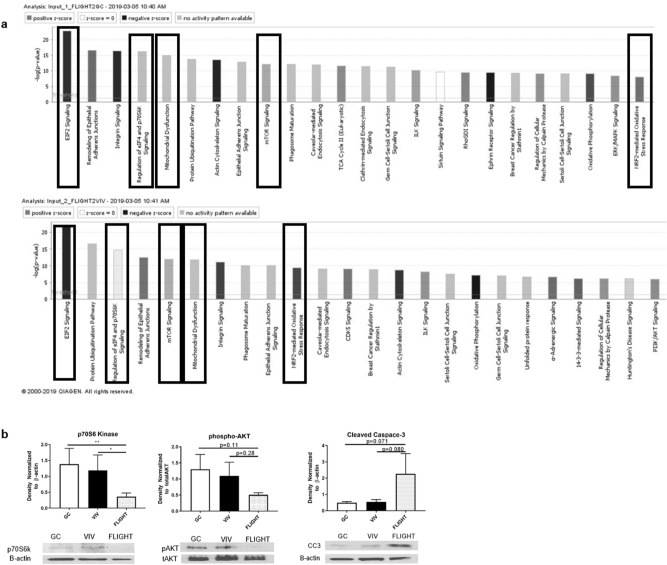
Figure 4.
Ingenuity Pathway Analysis (IPA) identifying altered canonical pathways, and supportive Western blot analyses (a) Canonical pathways comparisons of FLIGHT vs GC (top) and FLIGHT vs VIV (bottom) indicate involvement of catabolic response and increased oxidative stress via p70S6K, mitochondrial dysfunction, mTOR signaling and NRF2-mediated oxidative stress; color coding indicates directional change in pathway activity (n = 10/group). (b) p70S6 Kinase was reduced vs controls post-FLIGHT (n = 3/group); pAKT (s473) was marginally lower post flight (n = 3/group); Cleaved Caspase-3 was increased post-flight (n = 3/group). *p < 0.05, **p < 0.01.

