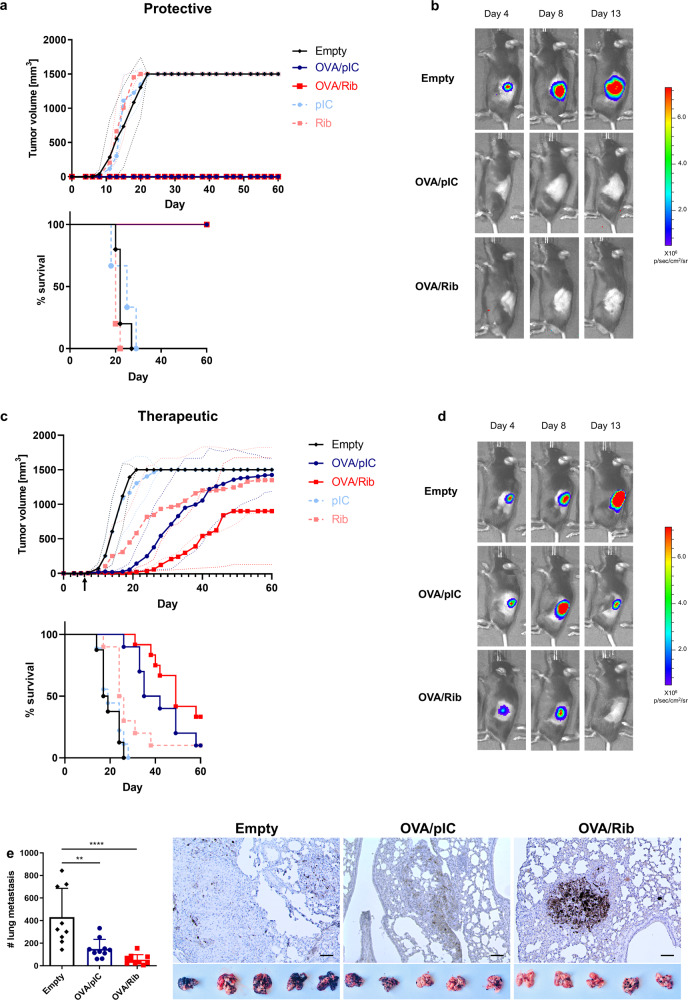
Fig. 5. Superior immunotherapeutic efficacy of PLGA-MP containing tumor antigens and Riboxxim in multiple tumor models.
a C57BL/6J mice were immunized subcutaneously with 5 mg PLGA-MP-OVA/polyI:C (OVA/pIC, blue circles, n = 5), PLGA-MP-OVA/Riboxxim (OVA/Rib, red squares, n = 5), empty control PLGA-MP (Empty, black diamonds, n = 5) or adjuvant control MP (pIC, light blue circles, n = 3; Rib, light red squares, n = 5). Six days post-immunization, mice were s.c. inoculated with 5 × 10⁵ E.G7-OVA-luc+ thymoma cells into the left flank. Tumor growth curves and Kaplan–Meier survival analysis of the protective E.G7 tumor model are shown. Data are presented as mean ± S.D. with dotted lines in corresponding colors demonstrating individual data variances. b Representative IVIS® images demonstrating tumor protection after PLGA-MP antitumor treatment. Scaling of the bioluminescent pseudo-color code is shown and presented as photons/seconds/cm2/steradian (p/sec/cm/sr). c For a therapeutic setting, C57BL/6J (n = 10) mice were s.c. challenged with 5 × 10⁵ E.G7-OVA-luc+ cells. As soon as palpable tumors were detectable, mice were immunized with PLGA-MP-OVA/polyI:C (OVA/pIC, blue circles, n = 10), MP-OVA/Riboxxim (OVA/Rib, red squares, n = 10), empty control PLGA-MP (Empty, black diamonds, n = 10) or adjuvant control MP (pIC, light blue circles, n = 9; Rib, light red squares, n = 10). Tumor growth curve and overall survival are presented showing that OVA/Rib particles significantly delayed tumor growth. Data are presented as mean ± S.D. with dotted lines in corresponding colors demonstrating individual data variances. Results are representative of two independent experiments with a similar outcome. d Representative IVIS® images showing tumor regression after therapeutic PLGA-MP vaccination. Scaling of the bioluminescent pseudo-color code is depicted on the right and presented as photons/seconds/cm2/steradian (p/sec/cm/sr). e C57BL/6J mice were subcutaneously primed with MP-OVA/polyI:C (OVA/pIC, blue circles, n = 10) or MP-OVA/Riboxxim (OVA/Rib, red squares, n = 10) on day −21. Control mice were injected with the corresponding amount of empty particles (Empty, black diamonds, n = 9). 14 days later, mice received an intranasal boost with 2.5 mg of the respective microparticles (day −6) corresponding to 125 µg tumor antigen and 1.25 µg dsRNA adjuvant. On day 0, immunized mice were challenged by intravenous injection of 1 × 10⁵ OVA-expressing MO5 melanoma cells. 21 days post tumor inoculation, numbers of melanoma tumor foci in the lungs were determined. Images (×200) representative of lung tumor tissue sections at the endpoint showing CD8+ T-cell infiltration into the tumor nodule as determined by immunohistochemical staining for CD8. Scale bars, 50 µm. Representative photographs of dissected lungs from melanoma-bearing mice of the indicated treatment group are shown below. Statistics: one-way ANOVA with a Tukey’s multiple comparisons test. **P < 0.01; ****P < 0.0001. Data represent means ± SD from three independent experiments with a similar outcome.

