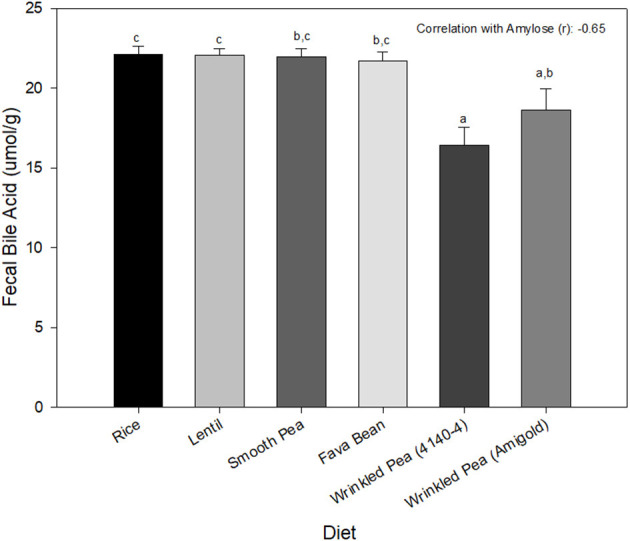
Figure 2.

Fecal bile acid content from dogs after 7 days of feeding each test diet. Diets are listed in order of increasing fiber and amylose content from left to right. Data is shown as Mean ± SEM; n = 8 dogs. Different letters indicate significant differences using Tukey's post-hoc analysis (P < 0.05) after 1-Way Repeated Measures ANOVA.
