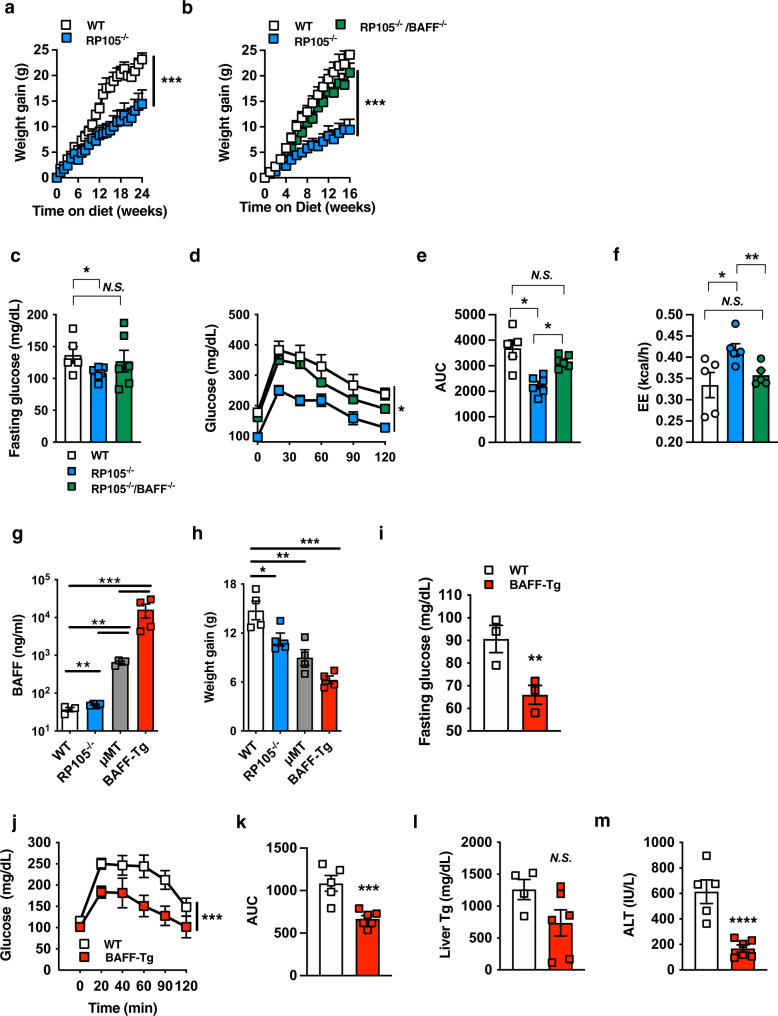
Fig. 1. BAFF axis regulates obesity development.
a Weight gain of WT or RP105−/− mice fed a high-fat diet (HFD) for 24 weeks. b–d WT, RP105−/− or RP105−/−/BAFF−/− mice were fed HFD for 16 weeks. b Weight gain. c Fasting glucose. d Glucose tolerance test (GTT). e Area under the curve (AUC). f Low-fat chow diet fed WT, RP105−/−, or RP105−/−/BAFF−/− were monitored in TSE Phenomaster systems for 3 days. Combined energy expenditure. g–h WT, RP105−/−, μMT or BAFF-Tg mice fed HFD for 15 weeks. g Systemic BAFF concentration quantified by ELISA. h Weight gain. i–m WT or BAFF-Tg mice fed HFD for 20 weeks. i Fasting glucose at 20 weeks. j GTT at 12 weeks. k AUC. l Liver triglycerides quantified by colorimetric assay at harvest. m Systemic alanine transaminase (ALT) at harvest. a Representative of six independent experiments, n = 4–8/condition. b–e Representative of three independent experiments, n = 4–7/condition. f A single experiment, n = 5–6/condition. g–h Representative of three independent experiments, n = 3–4/condition. i–m Representative of three independent experiments, n = 3–6/condition. a–m For bar and line graphs, data represents mean±SEM. a–b, d–e, j–k Area under the curve. N.S = not significant, *p < 0.05, ***p < 0.001. g–h One-way ANOVA with Tukey correction. *p < 0.05, **p < 0.01, ***p < 0.001. c, f, i, l–m) Unpaired two-tailed Student’s t test. *p < 0.05, **p < 0.01, ***p < 0.001, ****p < 0.0001. Source data are provided as a Source data file.

