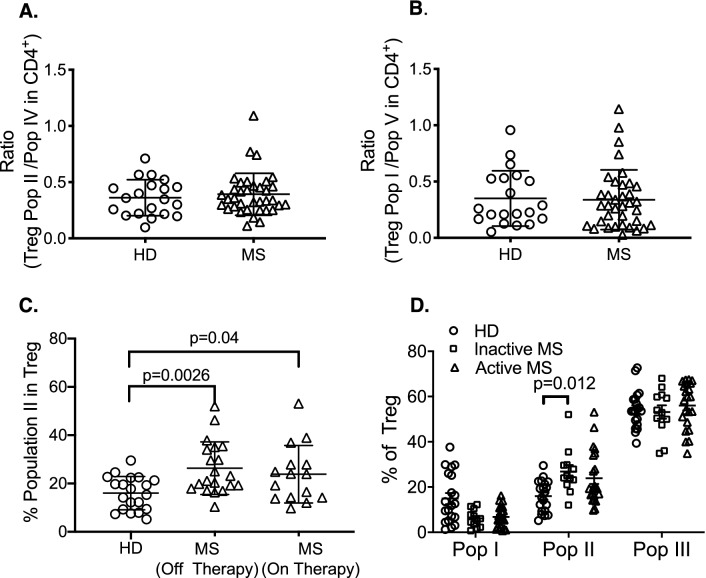
Figure 3.
Relationship of Treg to effector cell subpopulations and treatment in HD and MS patients. (A) Ratio of Treg Population II to activated/memory effector cells in population IV was examined. No significant difference was observed in MS (n = 36) compared to HD (n = 20). (B) Ratio of Treg Population I to effector cells in Population V found no significant difference between HD (n = 20) and MS patients (n = 36). (C) Comparison of Population II in Treg in HD (n = 20) and MS patients that either had no recent immunomodulatory therapy (n = 20) or received immunomodulatory therapy in last three months (n = 15). Significant differences were found between HD and MS patients who were off therapy (p = 0.0026) or were on immune modulating therapy for MS in the last three months of sampling (p = 0.04). (D) Comparison of Treg subpopulations in HD (n = 20), to patients with active MS (n = 22) and those who did not have active MS (n = 12). MS was classified as active if patients reported a clinical relapse or deterioration of symptoms within the last 3 months. Significant difference was observed in Treg Population II in MS patients with inactive disease compared to HD(p = 0.012). Patients with active MS, did not have an increase in Population II, albeit five of 20 patients had increased number of Population II above mean value for HD.

