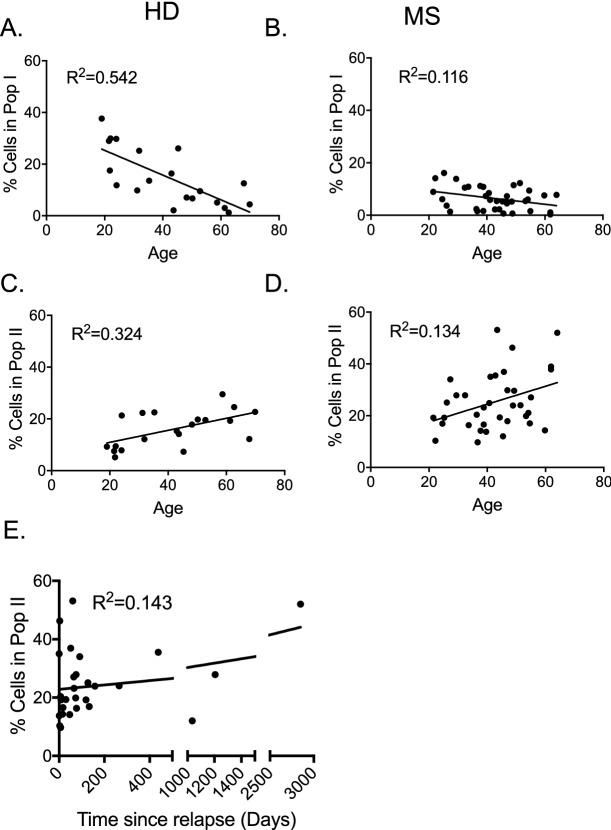
Figure 4.
Regression analysis of Populations I and II in CD4+CD25+CD127loTreg. The proportion of Treg in Populations I and II were analysed for correlation with age of HD and MS patients. (A,B) Linear regression analysis of Populations I with age in HD (n = 20) (A) and MS (n = 36) (B). In HD, Population I decreased with age (R2 = 0.542) but not in MS patients (R2 = 0.116). (C,D) Linear regression analysis of Populations II with age in HD (n = 20) (C) and MS (n = 36) (D). Population II increased with age for HD (R2 = 0.324) and MS (R2 = 0.134). (E) Linear regression analysis of Population II with time since last MS relapse showed correlation (R2 = 0.143) (p < 0.05).

