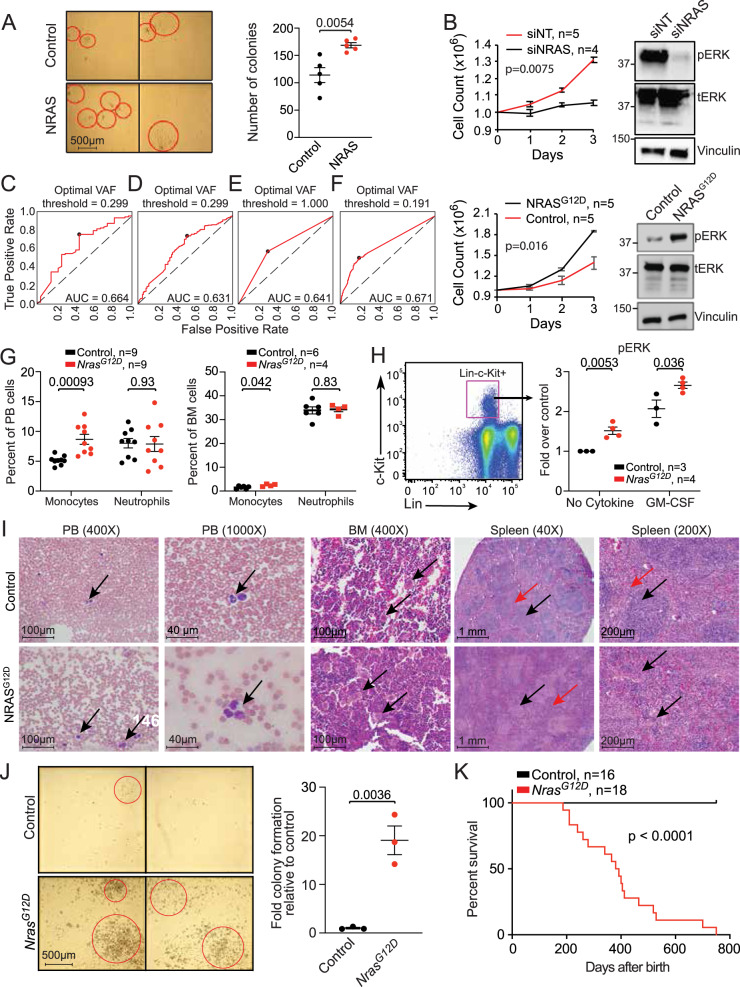
Fig. 3. NRASG12D mutation drives a proliferative CMML phenotype.
A. Representative hematopoietic progenitor colony formation assay using NRAS-wild-type CMML patient-derived mononuclear cells (MNCs) after transduction with either a null adenoviral construct (control) or NRAS-expressing vector (NRAS). Red circles indicate individual colonies. Scatter plot depicts colony counts at day 12 after inoculation in five individual cases. B Daily cell counts of CMML patient-derived MNCs after siRNA depletion of NRAS in NRASG12D cells (above) and transfection of NRASG12D in NRAS wild-type cells (below). Representative western blots of three experiments are depicted for validation by assessing phosphorylated ERK (pERK) relative to total ERK (tERK) levels with Vinculin as a loading control. Knockdown of NRAS by qPCR was ≥85%. Indicated p-value in panels A and B by two-tailed Student’s t test. C–F Receiver operating characteristic curve (ROC) analyses illustrating the diagnostic ability of variant allele frequency (VAF) of NRAS mutations (C) or oncogenic RAS pathway mutations (NRAS, KRAS, CBL, PTPN11) (D) at discrimination between pCMML and dCMML phenotypes. If >1 mutation was present in the sample, maximal VAF was used. Impact of VAFRAS as a predictor of pCMML vs dCMML phenotype, using binary RAS mutation status (E), or a continuous VAFRAS value (F). Characterization of the Vav-Cre-NrasG12D mouse model of CMML is depicted at 6 weeks of age (panels G–I) and when moribund (panels J and K). G Differences in peripheral blood (PB, left) and bone marrow (BM, right) monocytes and neutrophils in NrasG12D mice relative to wild-type controls. H BM cells were serum- and cytokine-starved for 2 h at 37 °C. Cells were then stimulated with or without 2 ng/ml of mGM-CSF for 10 min at 37 °C. Levels of phosphorylated ERK1/2 (pERK) were measured using phosphor-flow cytometry. Myeloid progenitors are enriched in Lin-/low c-Kit+ cells. Indicated p-value in panels G and H by two-tailed Student’s t test. I Histopathologic comparisons between wild-type control (top) and NrasG12D (bottom) mouse PB, BM, and spleen. PB smears depict monocytes (arrows). BM shows normal hematopoiesis (arrows, above) and megakaryocytic atypia and hyperplasia (arrows, below). Lower power spleen reveals normal white and red pulp (black and red arrows respectively, above) with effacement of this architecture (black and red arrows, below). High power spleen reveals normal white and red pulp architecture (black and red arrows respectively, above) and dysplastic megakaryocytes (arrows, below). J Representative hematopoietic progenitor colony formation assay using MNCs from wild-type control (top) and NrasG12D (bottom) mice. Bar graph depicts colony counts at day 12 after inoculation. Indicated p-value by two-tailed Student’s t test. K Kaplan–Meier curve demonstrating overall survival of NrasG12D mice relative to wild-type controls. Data in panels A, B, G, H and J are presented as mean ± SEM. The indicated n represents the number of biologic replicates. P-values are indicated with each comparison. Source data are provided as a Source Data file.

