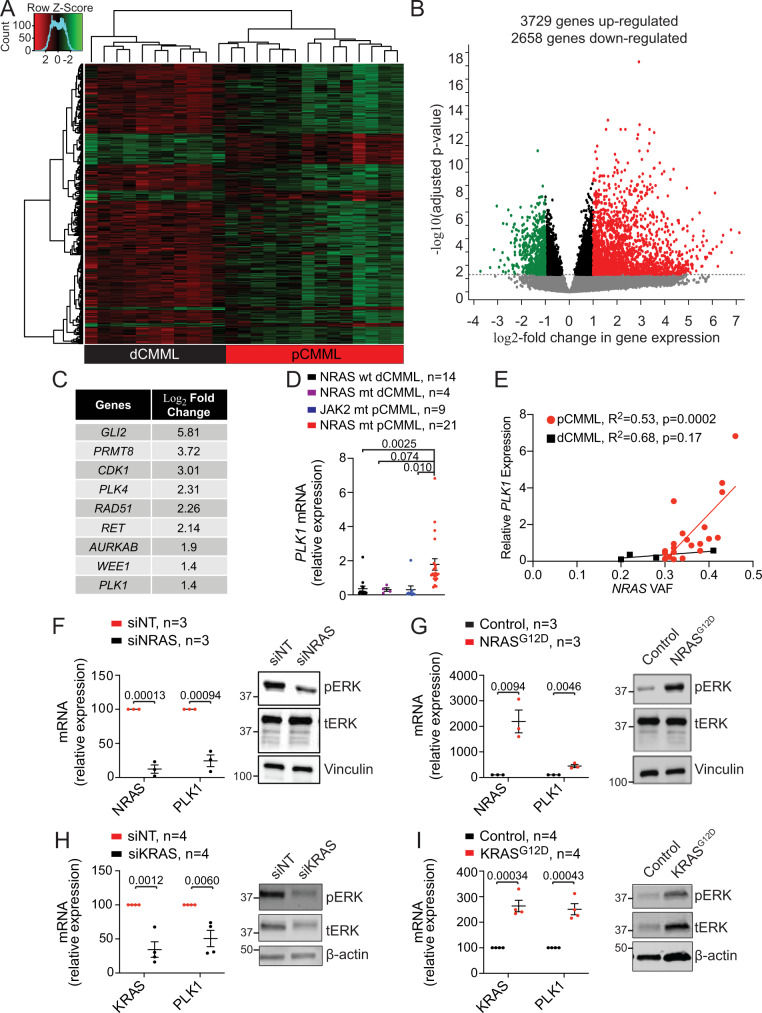
Fig. 4. RAS pathway mutations drive expression of mitotic checkpoint kinase PLK1.
A Unsupervised hierarchical clustering of RNA-seq performed on peripheral blood samples from 35 CMML patients. Cluster 1 (black) with RAS wild-type dCMML cases and Cluster 2 (red) with RAS mutant pCMML cases. B Volcano plot demonstrating differentially upregulated (red) and downregulated (green) genes in RAS mutant pCMML (vs RAS wild-type dCMML) expressed as log2-fold change. Indicated p-values on the y-axis is calculated by the Wald test and false discovery rate-corrected. C Table of most upregulated therapeutically actionable genes in pCMML relative to dCMML. D Quantitative PCR (qPCR) validation of PLK1 expression in patient-derived MNCs from NRAS wild-type (wt) dCMML, NRAS mutant (mt) dCMML, JAK2 mt pCMML, and NRAS mt pCMML cases. E Scatter plot comparing relative PLK1 expression to variant allele frequency (VAF) of NRAS mutation. F qPCR for NRAS and PLK1 in NRAS mutant pCMML MNCs after transfection with non-targeting siRNA (siNT), or siRNA against NRAS (siNRAS). G qPCR for NRAS and PLK1 in NRAS wild-type dCMML patient-derived MNCs after transfection with an empty vector (Control) or NRASG12D. H qPCR for KRAS and PLK1 in KRAS mutant pCMML MNCs after transfection with siNT or siKRAS. I qPCR for KRAS and PLK1 in KRAS wild-type dCMML MNCs after transfection with an empty vector (Control), or KRASG12D. Western blots in panels F–I are representative of three experiments. Data in panels D and F–I are presented as mean ± SEM. Indicated p-value in panels D–I by two-tailed Student’s t test. The indicated n represents the number of biologic replicates. Source data are provided as a Source Data file.

