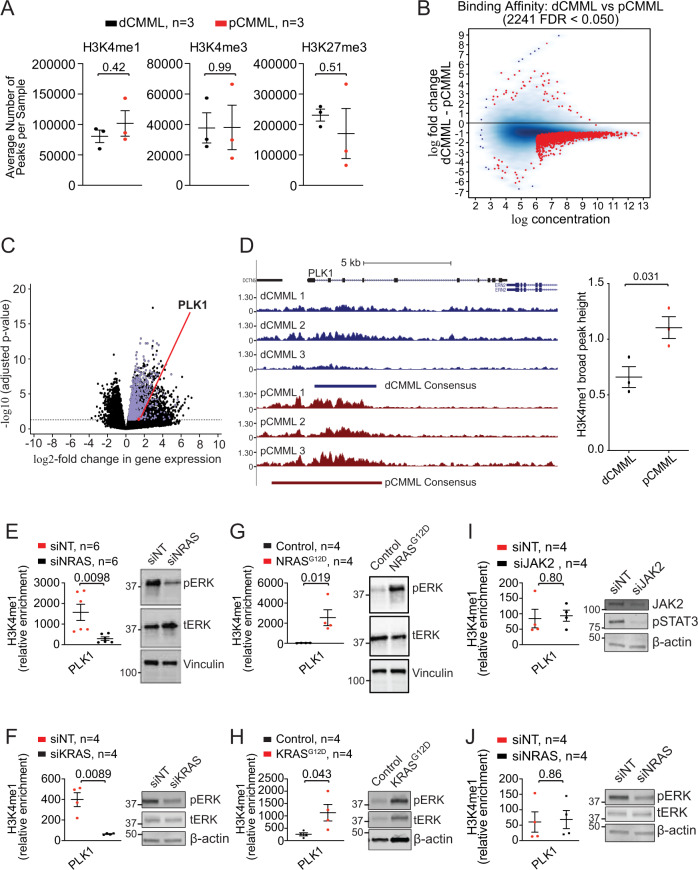
Fig. 5. Genome-wide and sequence-specific enrichment of the H3K4me1 histone mark in RAS mutant pCMML.
A ChIP-seq on BM MNC from CMML patients assessing relative global enrichment of histone 3 lysine 4 monomethylation (H3K4me1), trimetylation (H3K4me3), and histone 3 lysine 27 trimethylation (H3K27me3). Indicated p-value by two-tailed Student’s t test. B MA plot of differential binding analysis of ChIP-seq H3K4me1 peak data. Each point represents a binding site with each red data point representing sites identified as differentially enriched. C Volcano plot integrating differential enrichment of H3K4me1 at gene promoters in RAS mutant pCMML (vs RAS wild-type dCMML) with differentially upregulated gene expression (purple) in RAS mutant pCMML expressed as log2-fold change. PLK1 is indicated as a red data point. Indicated p-values on the y-axis is calculated by the Wald test and false discovery rate-corrected. D Enrichment and consensus peak calling for H3K4me1 occupancy at the PLK1 locus. Three individual traces from RAS wild-type dCMML (blue, above) and RAS mutant pCMML (red, below) patients are depicted. Relative localization along the PLK1 gene body is depicted. The broad consensus peaks are indicated below each set of patient samples. The accompanying box plot indicates differences in H3K4me1 consensus peak height between pCMML and dCMML samples. Indicated p-value by two-tailed Student’s t test. E–J ChIP-PCR of CMML MNCs assessing PLK1 promoter occupancy of H3K4me1. This was done in NRAS mutant (E) or KRAS mutant (F) MNCs after transfection with siNT or siNRAS/siKRAS. Western blots are representative validation of RAS knockdown. It was also performed in NRAS (G) or KRAS (H) wild-type MNCs after transfection with a control vector or NRASG12D/KRASG12D. Western blots are representative validation of RAS knockdown. I ChIP-PCR was performed in JAK2 mutant MNCs after transfection with siNT or siJAK2. Validation of JAK2 knockdown is done using phosphorylated STAT3 (pSTAT3) levels. J ChIP-PCR was also performed in NRAS mutant dCMML MNCs after transfection with siNT or siNRAS. Western blots in panels E–J are representative of three experiments. Indicated p-value in panels E–J by two-tailed Student’s t test. Data in panels A, D, and E–J are presented as mean ± SEM. The indicated n represents the number of biologic replicates. Source data are provided as a Source Data file.

