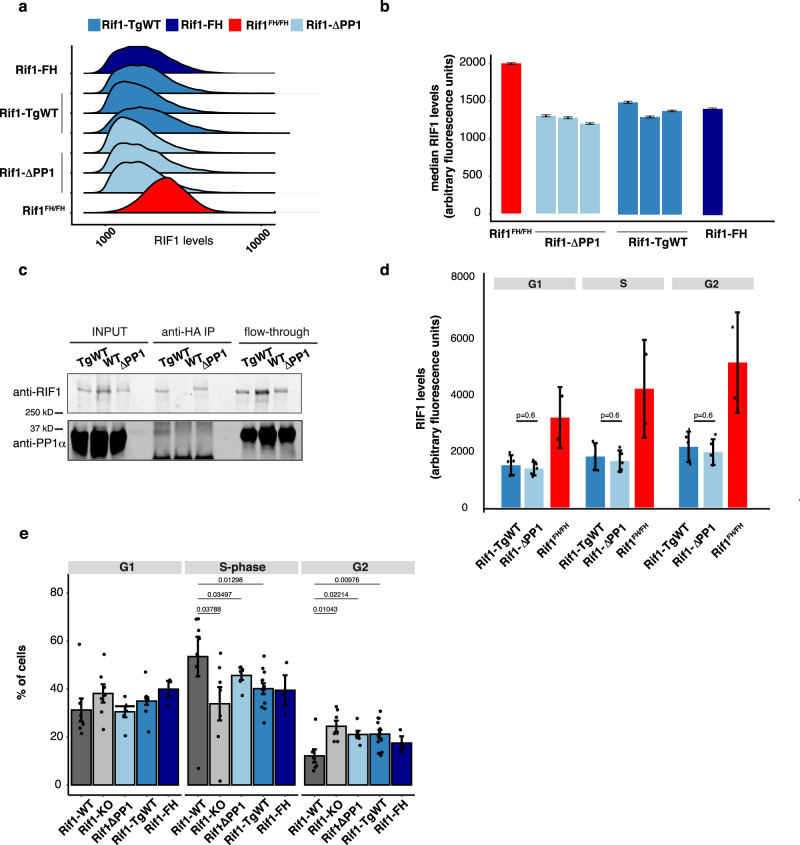
Fig. 1. Expression levels and chromatin association of RIF1-TgWT and RIF1-ΔPP1 are comparable to those of RIF1 in hemizygous cells.
a Quantitative analysis of total levels of FH-tagged RIF1, measured by intra-cellular FACS staining. Anti-HA mouse ascites 16B12 was used to stain the indicated cell lines. Rif1FH/FH: homozygous knock-in FH-tagged RIF1, as a control of quantitative staining. The plot shows distributions of densities from HA signal, measured in arbitrary units. One representative experiment is shown. b Quantification from Fig. 1a. The bar plot represents the median intensities for the experiment shown and the error bars indicate 95% confidence intervals, calculated through bootstrapping with 10,000 iterations. c Total proteins were extracted from cells expressing untagged wild type RIF1 (WT), or from hemizygote cells expressing RIF1-TgWT or RIF1-ΔPP1 (HA tagged), and immunoprecipitated with anti-HA antibody. The input, immunoprecipitated complex and flow through were analysed by western blot with anti-mouse RIF1 affinity-purified rabbit polyclonal antibody (1240) and anti-PP1α. d Quantitative analysis of the levels of chromatin-associated FH-tagged RIF1 throughout the cell cycle measured by FACS staining. Cytoplasmic and nucleoplasmic proteins were pre-extracted before fixing chromatin-associated proteins. Anti-HA mouse ascites 16B12 was used to visualise FH-tagged RIF1 as in a. Cell cycle stage was determined by DNA quantification (DAPI staining). Means from the results from two independent experiments, each with 2 or 3 independent cell lines per genotype are summarised. The error bars indicate standard deviations. P values were calculated by two-sided unpaired t test. e Cell cycle distribution of the indicated cell lines, as determined by FACS quantification of EdU incorporation (S-phase) and DAPI staining (DNA amount). The mean value of three independent clones per genotype, from three experiments is shown. Error bars indicate the standard error of the mean. P values are calculated using two-sided Wilcoxon rank-sum test.

