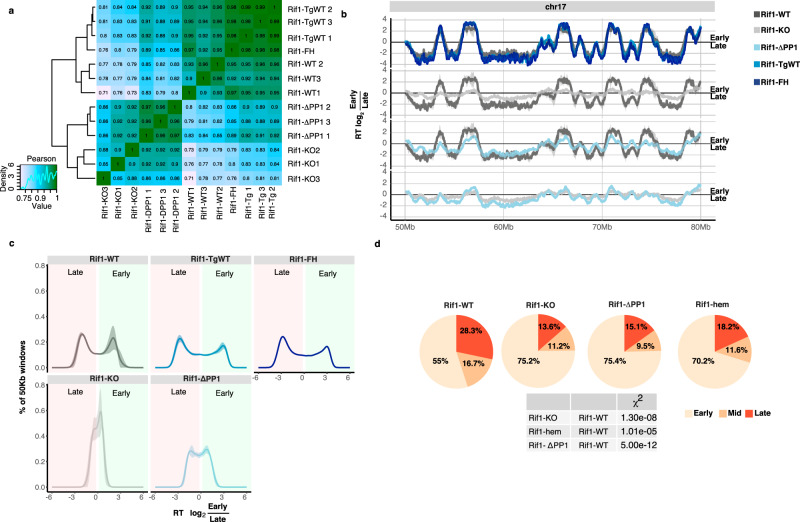
Fig. 2. Effect of loss of RIF1–PP1 interaction on the replication-timing programme and on the spatial distribution of replication foci.
a Hierarchical cluster analysis of Pearson correlation coefficient of genome-wide replication-timing (RT) profiles between replicas, bin size 50 kb. The analysis shows preferential clustering of RT distribution from Rif1-KO and Rif1-ΔPP1 lines, while RT distribution from Rif1-WT clusters with Rif1-TgWT and Rif1-FH lines. b Representative RT profile from Chromosome 17. The solid line shows the mean of three biological replicas, except for Rif1-FH (single, parental clone). RT scores are calculated as the log2 of the ratio between mapped reads in the early and late replicating fractions of the cell cycle over bins of 50 kb. c Genome-wide distribution of 50 kb genomic windows on the basis of their RT scores. Mean of three independent lines per genotype is shown, except for Rif1-FH. Shaded areas represent standard deviations. If the mean minus the standard deviation was <0, it was set to 0. RT scores from Rif1-WT and Rif1 hemizygous lines (Rif1-TgWT and Rif1-FH) show a bimodal distribution, defining distinct early and late genomic regions. On the contrary, the distribution of RT scores from Rif1-KO lines shows a tendency towards a unimodal distribution, centred around zero. Rif1-ΔPP1 lines display an increase in the windows with RT close to 0, but still a bimodal distribution of the RT values. d The spatial distribution of replication foci (replication patterns) was visualised by EdU and DAPI staining. Cells were pulsed for 30 min with EdU and fixed. Examples in Fig. S5A. Pie charts show the relative distribution of S-phase cells (EdU positive) between replication patterns corresponding to early, mid, and late S-phase. For each genotype, three independent lines and two separate experiments were blind-scored. As Rif-FH cells are a single cell line with no biological replicas (parental) and the results are very similar to the results from Rif1-TgWT, they were pooled (Rif1-hem). In the table, statistically significant differences are summarised. P values are calculated by χ2 test.

